Hosts
This page records the details about the hosts integrated with Zeron and provides the following details about each of them:
- Host details
- Mitre Att&ck tactics risks detected
- Endpoint Compliance mapping
- Configuration Assessment (CIS-CAT Audit) Score
- Risk count evolution graph
- CIA Triad Percentage
- Vulnerabilities detected
- Risks detected
- Sysmon risks detected
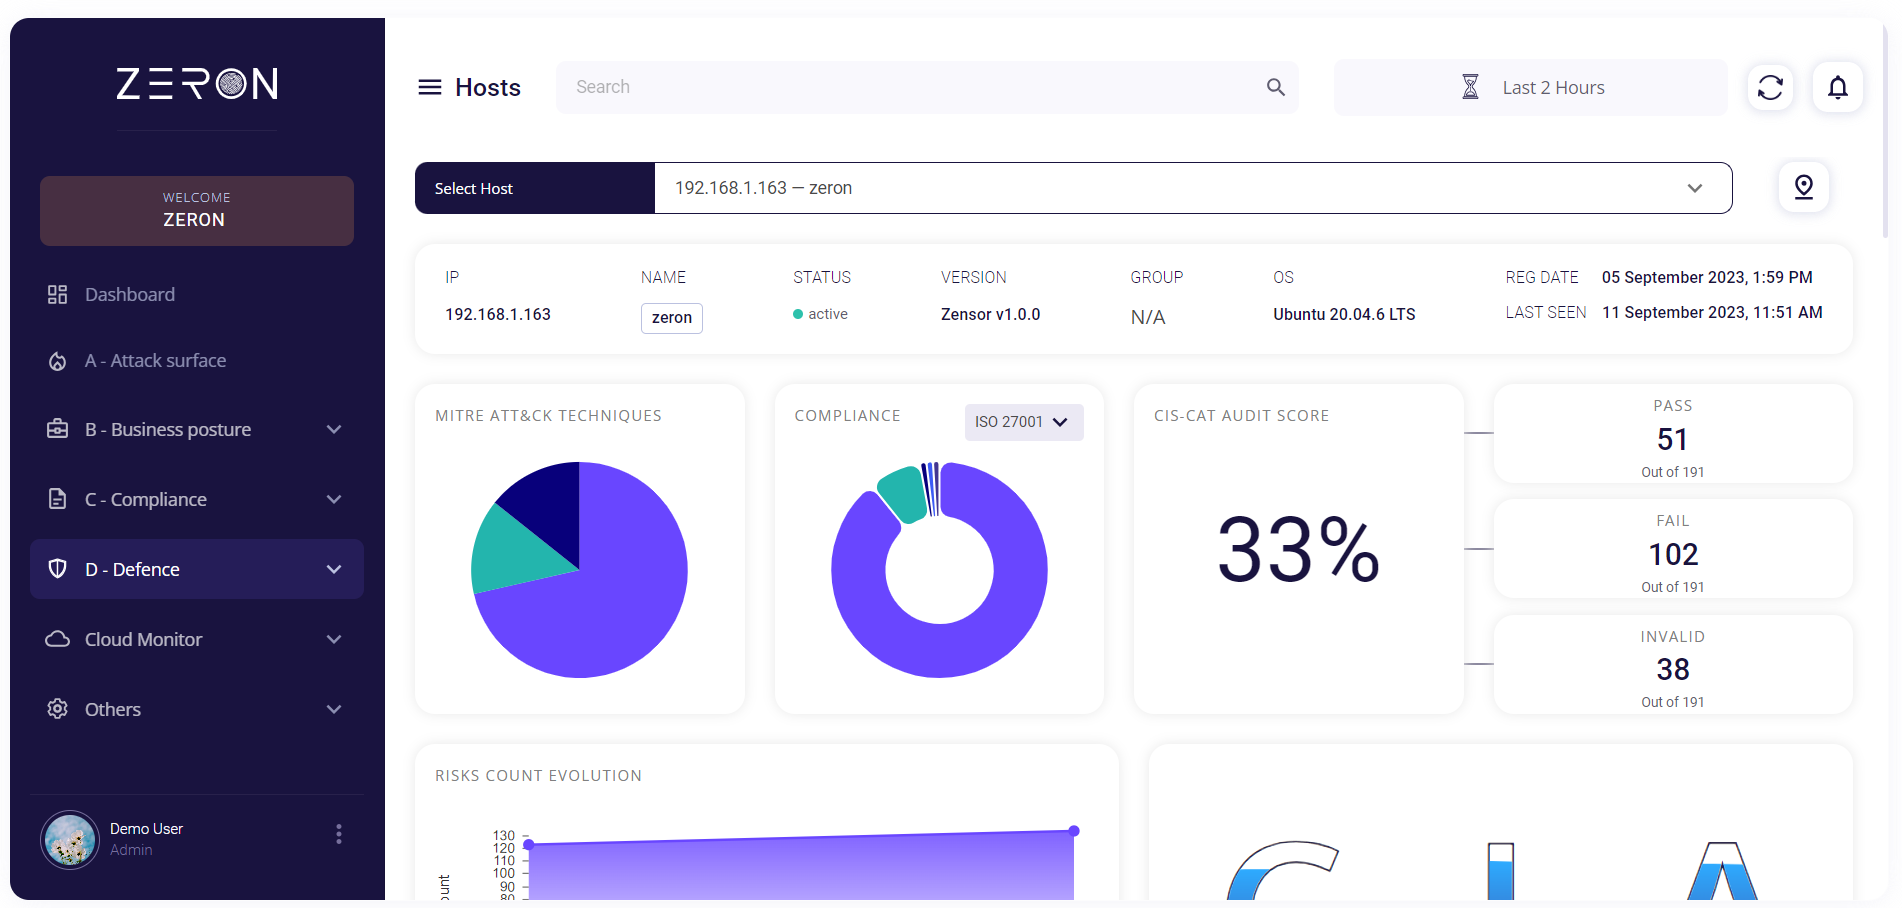
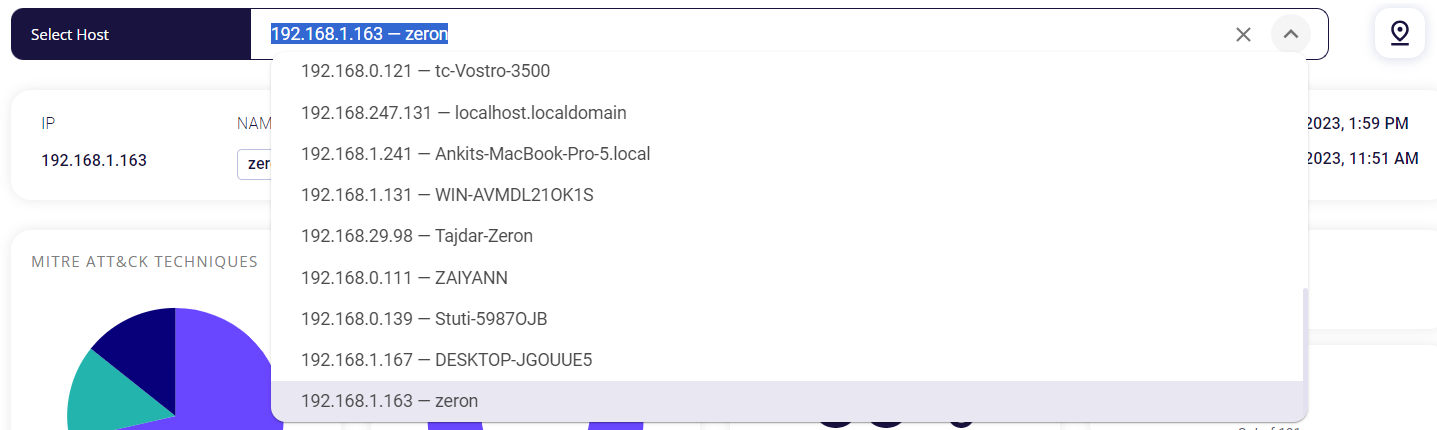
The top section of the page allows the user to select a host integrated with Zeron and provides the above-given details for the chosen host.
Host details
This block shows the IP address, name, status, version, group, OS, registration date, and last activity of the selected host.

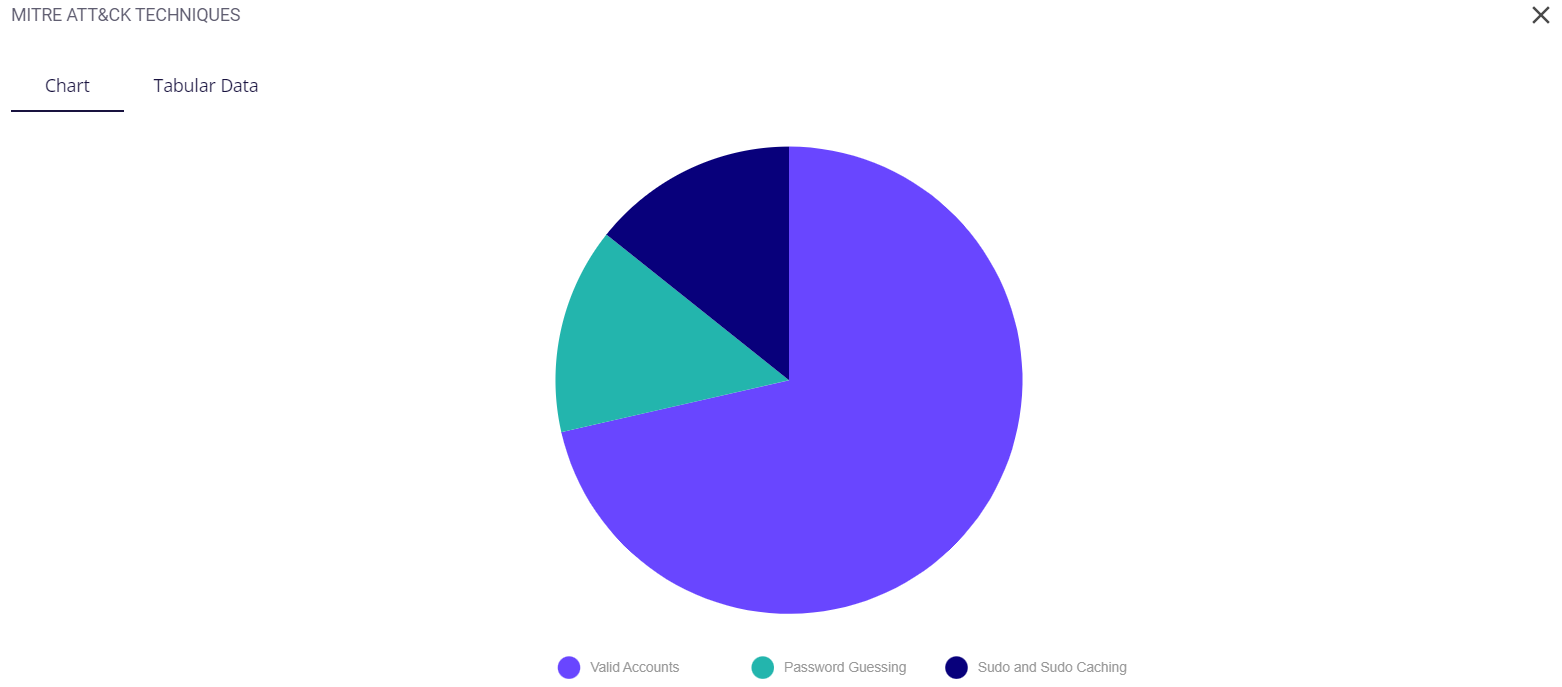
Mitre Att&ck tactics risks detected
This block contains a pie chart that visually categorizes the various MITRE ATT&CK Tactics risks detected for the selected host. Each MITRE ATT&CK Technique discovered has its own unique color assigned to it. Hovering over a particular color of the chart provides the user with the name of the technique and the number of tactics found under it for this host. Clicking on the full-screen icon on the bottom right of this block provides the user with an enlarged chart view and a tabular view of the same.
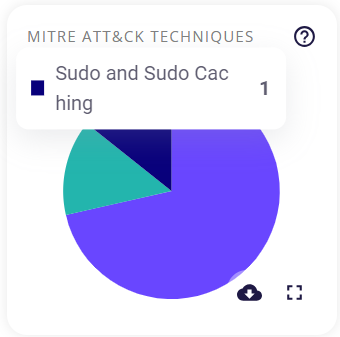
The key/legend of the chart is provided in the full-screen view, using which the user can map the techniques to their respective colors. Similar to the preview, hovering over a particular color of the chart provides the user with the name of the technique and the number of risks detected for it.
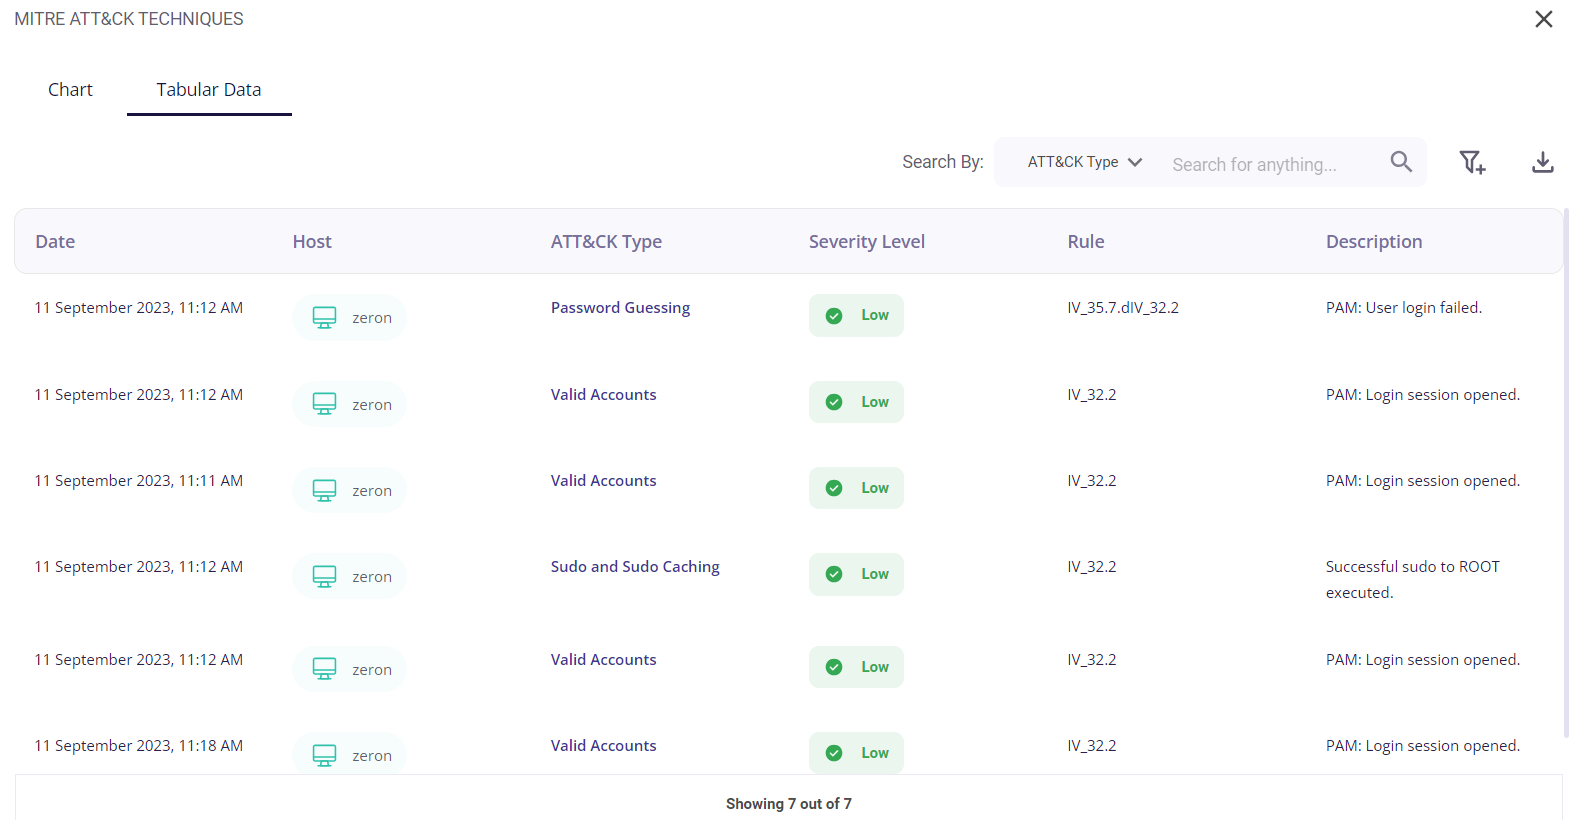
The tabular view provides the following info about the events through which the risks were detected:
- Date and time of occurrence
- Host
- MITRE ATT&CK type
- Security level (low/medium/high)
- Rule
- Description of the detected risk
The user can search for a particular event based on the Att&ck type, Rule, or severity level by clicking on the filter icon in the top right corner. A list of the events can be downloaded as a .csv file by clicking on the download button and then selecting the 'export as .csv' option, and the total number of events is given at the bottom of the table.
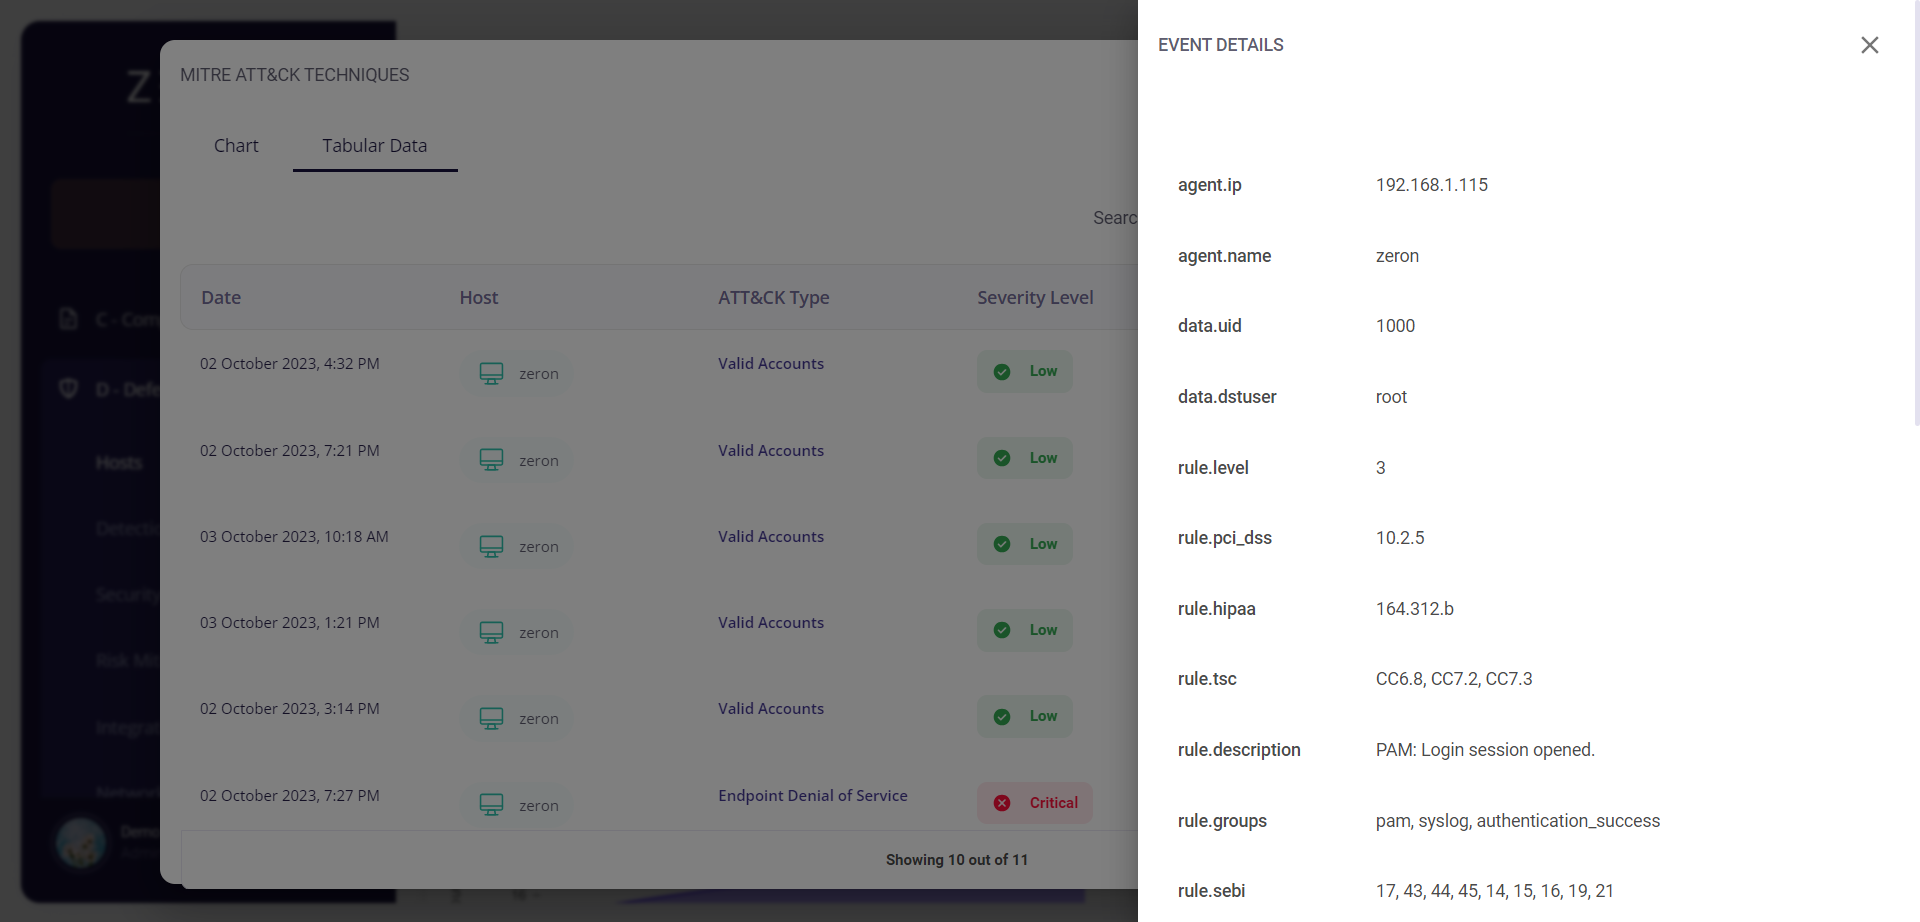
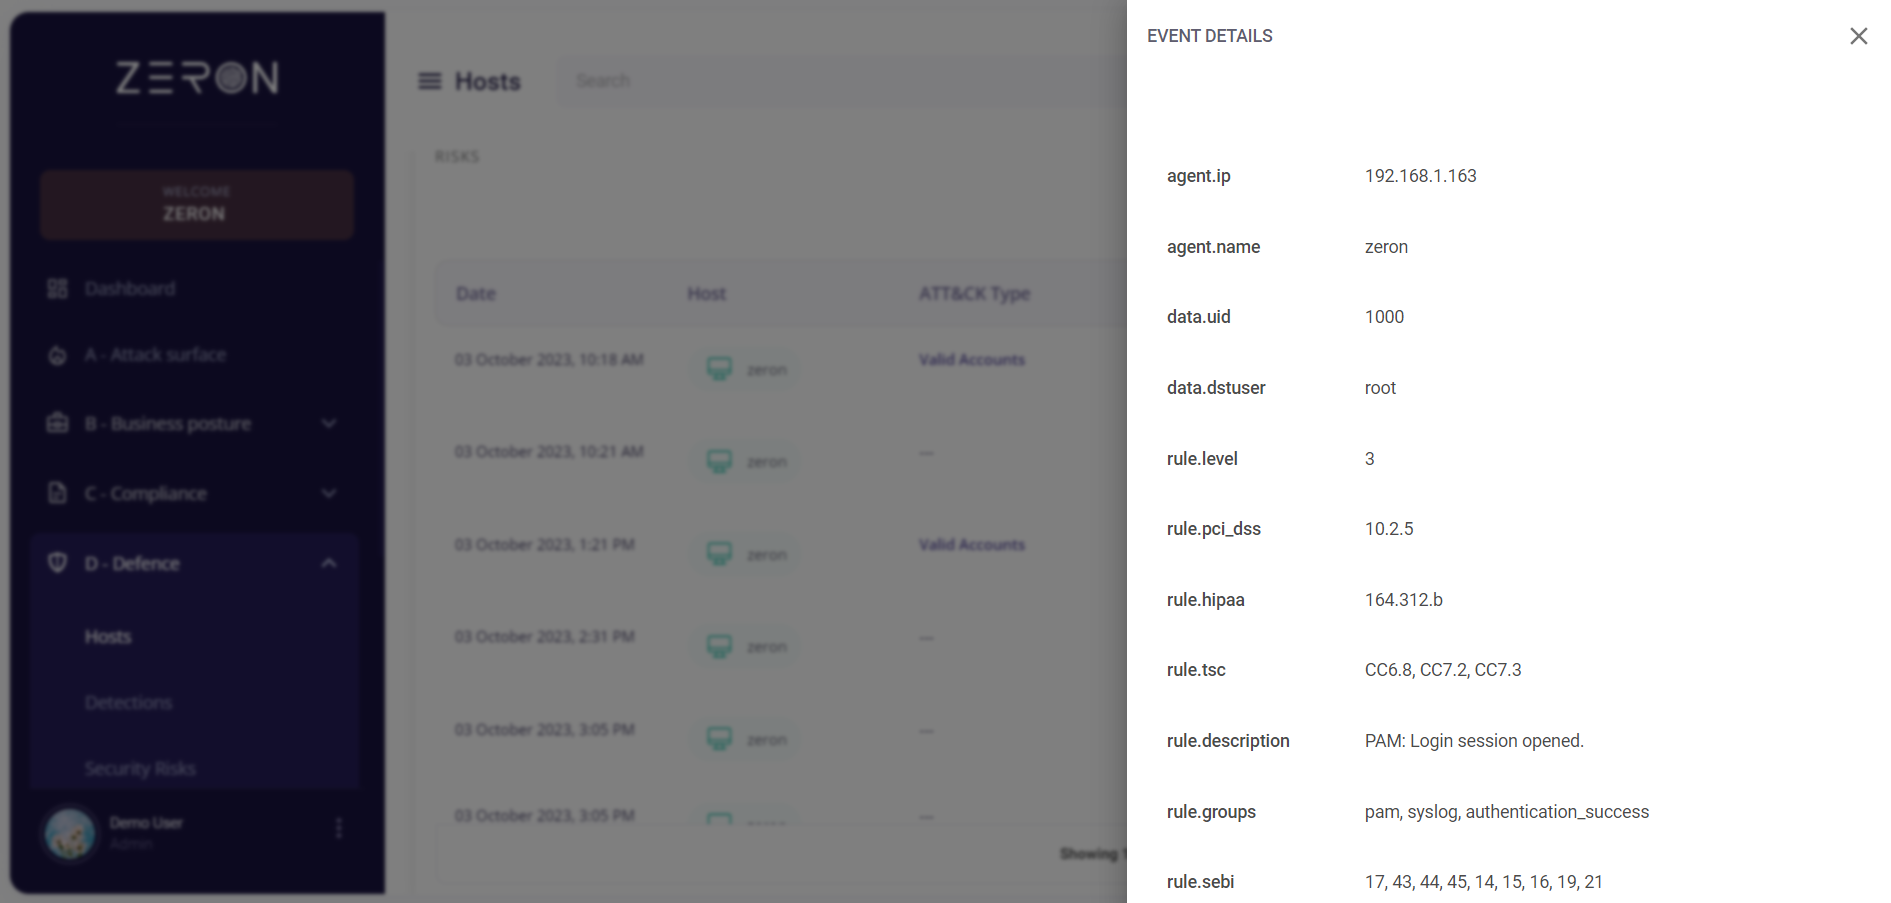
Clicking on the date of a particular event would provide the user with further details about it.
Clicking on the MITRE ATT&CK type of a particular event would redirect the user to the Risk Mitigation page, where he/she is provided with the details about that risk and can create cybersecurity initiatives corresponding to that particular risk.
You can read more about the Risk Mitigation page here.

Endpoint Compliance mapping
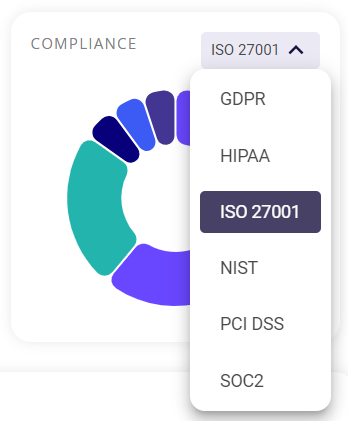
This block contains a donut chart depicting the number of risks detected that violate the compliance for that particular host. Hovering over a particular color will display which control the risk is related to and how many such risks have been found for that particular control.
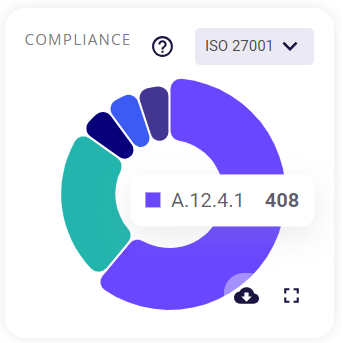
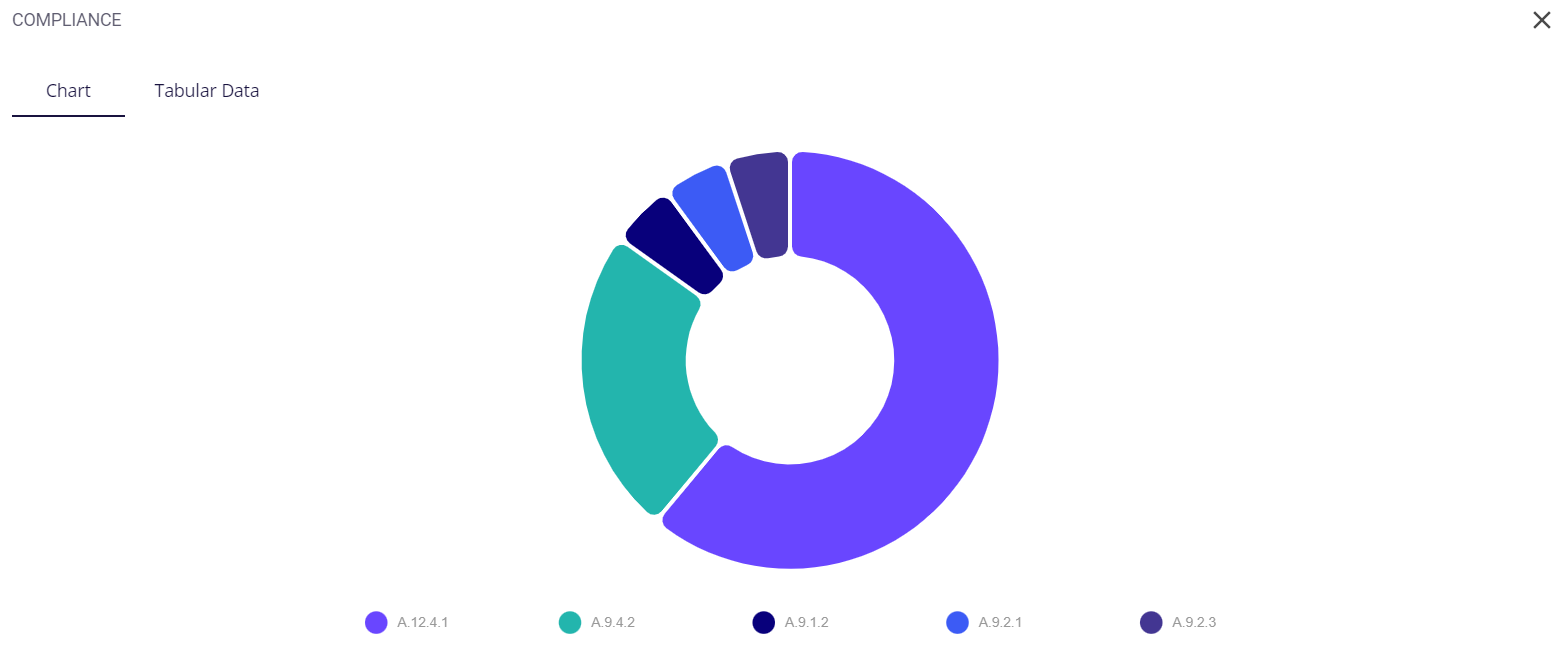
The user can choose to get a chart for any of the 7 compliances supported by Zeron (GDPR, HIPAA, ISO 27001, NIST, PCI DSS, and SOC2). Clicking on the full-screen icon on the bottom right of this block provides the user with an enlarged chart view and a tabular view of the same.
The key/legend of the chart is provided in the full-screen view, using which the user can map the controls to their respective colors. Similar to the preview, hovering over a particular color of the chart provides the user with the name of the control and the number of risks found for it.
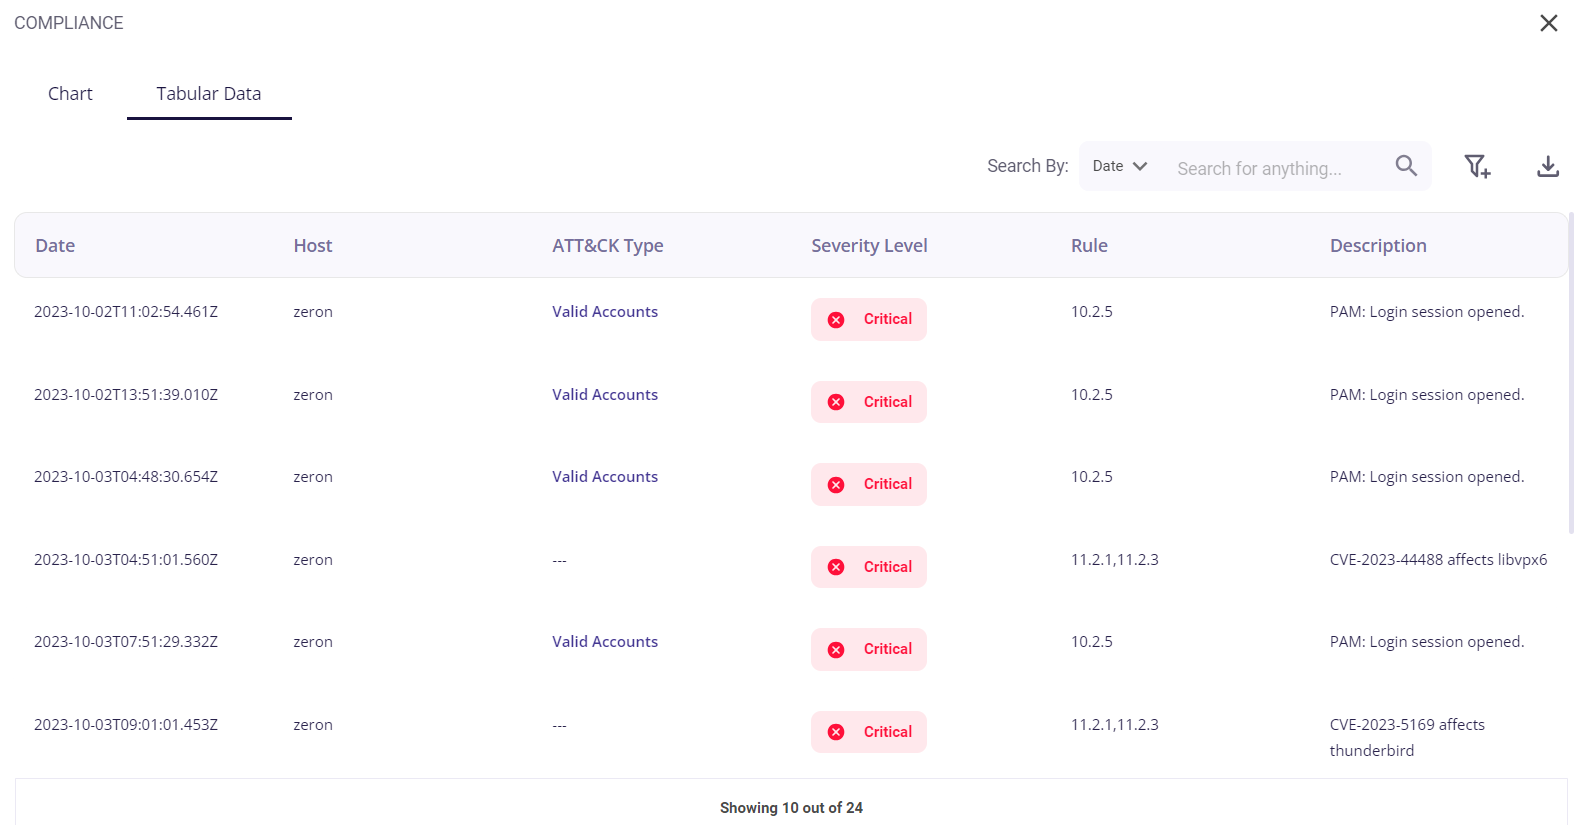
The tabular view provides the following info about the events through which the risks were detected:
- Date and time of occurrence
- Host
- MITRE ATT&CK type
- Security level (low/medium/high)
- Rule
- Description of the detected risk
The user can search for a particular event based on the Date, rule, or severity level by clicking on the filter icon in the top right corner. A list of the events can be downloaded as a .csv file by clicking on the download button and then selecting the 'export as .csv' option, and the total number of events is given at the bottom of the table.
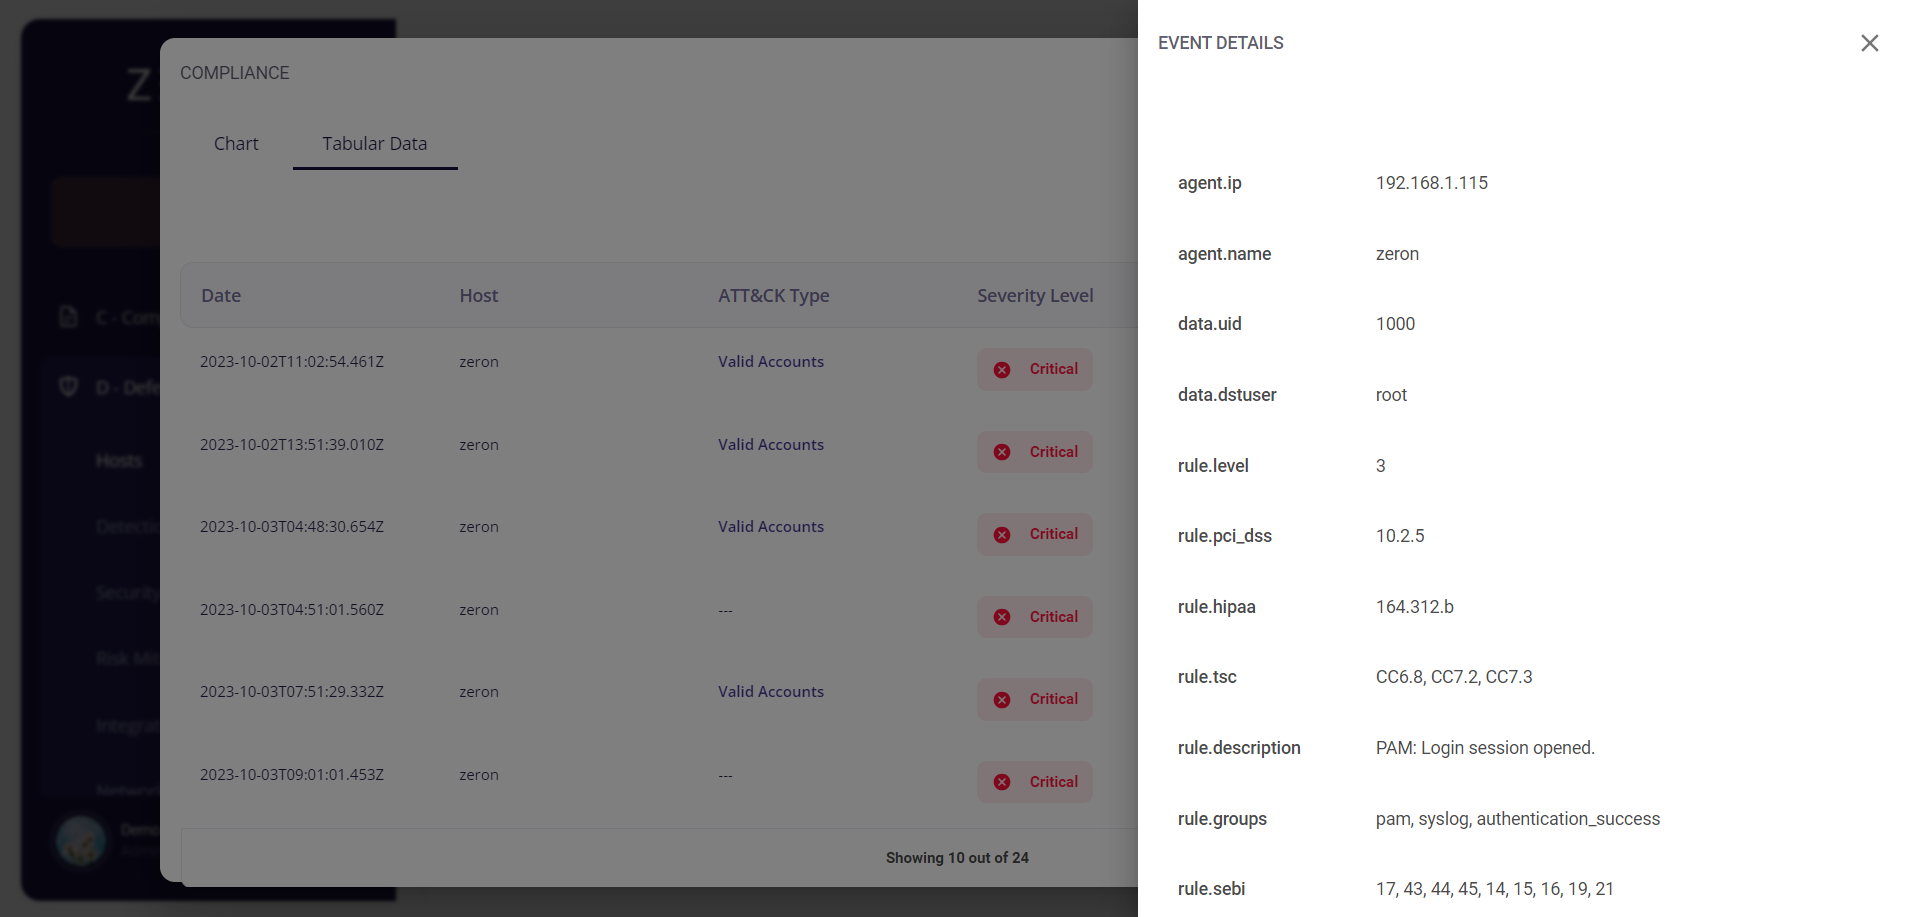
Clicking on the date of a particular event would provide the user with further details about it.
Clicking on the MITRE ATT&CK type of a particular event would redirect the user to the Risk Mitigation page, where he/she is provided with the details about that risk and can create cybersecurity initiatives corresponding to that particular risk.
You can read more about the Risk Mitigation page here.

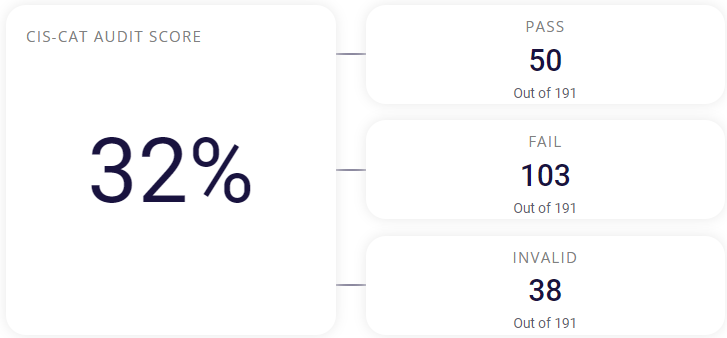
CIS-CAT Audit Score
This section shows the Configuration Assessment Score done on the host. It consists of 3 parts:
- Pass – The total number of machines that passed the security configuration.
- Fail – The total number of machines that failed the security configuration.
- Invalid – The total number of machines that are not valid for this security configuration.
The CIS-CAT Audit Score is calculated based on the above information obtained from the security configuration audit.
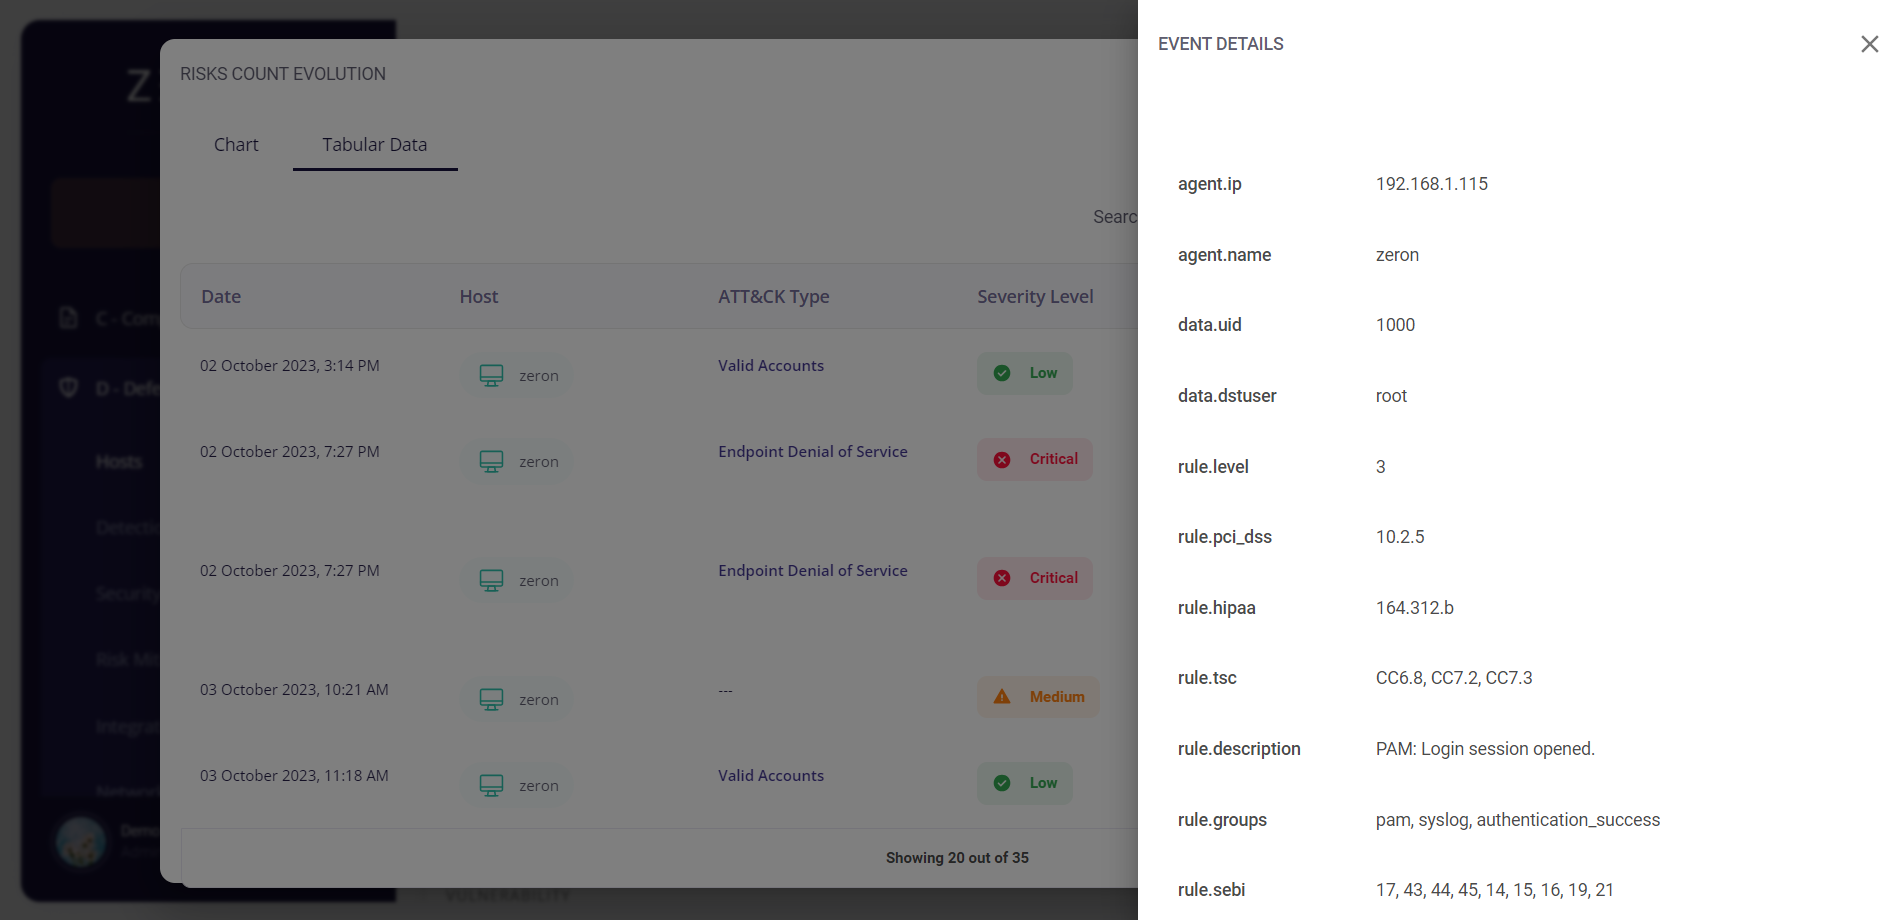
Risk count evolution
Shows the evolution (increase or decrease) of risks over the chosen time period by rendering a graph, which contains the event count plotted against the timestamp. This graph is produced using the data collected by Zensors for the selected host. Hovering over the graph gives the event count and when it has occurred.
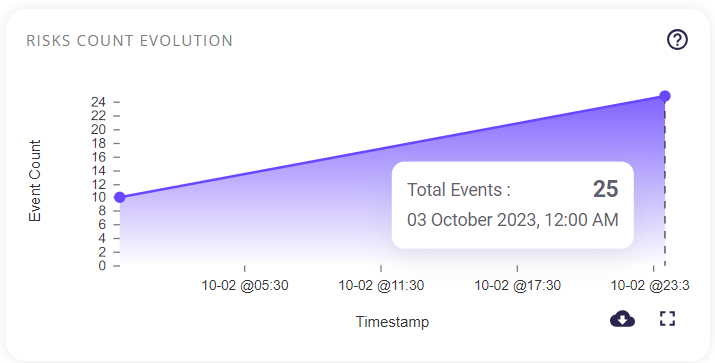
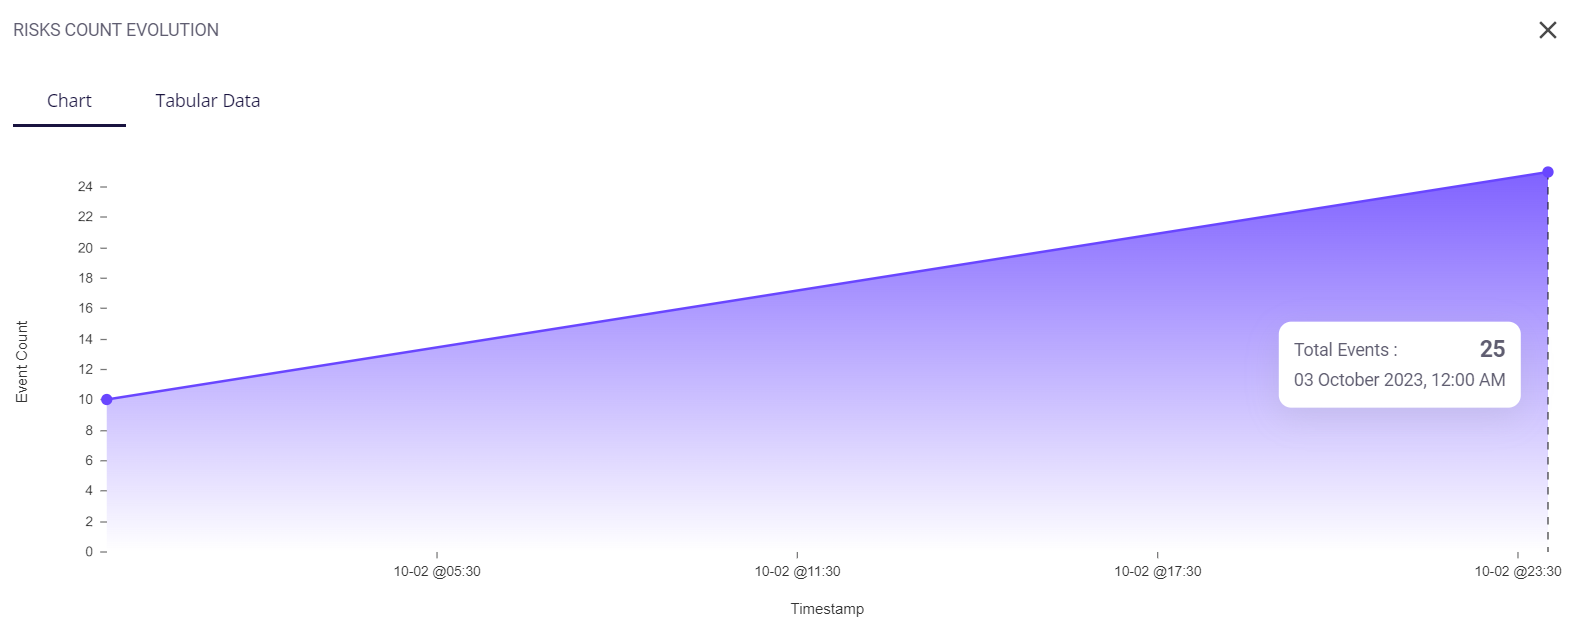
Clicking on the full-screen icon on the bottom right of this block provides the user with an enlarged chart view and a tabular view of the same. Similar to the preview, the user can also hover over this chart to get the event count and its timestamp.
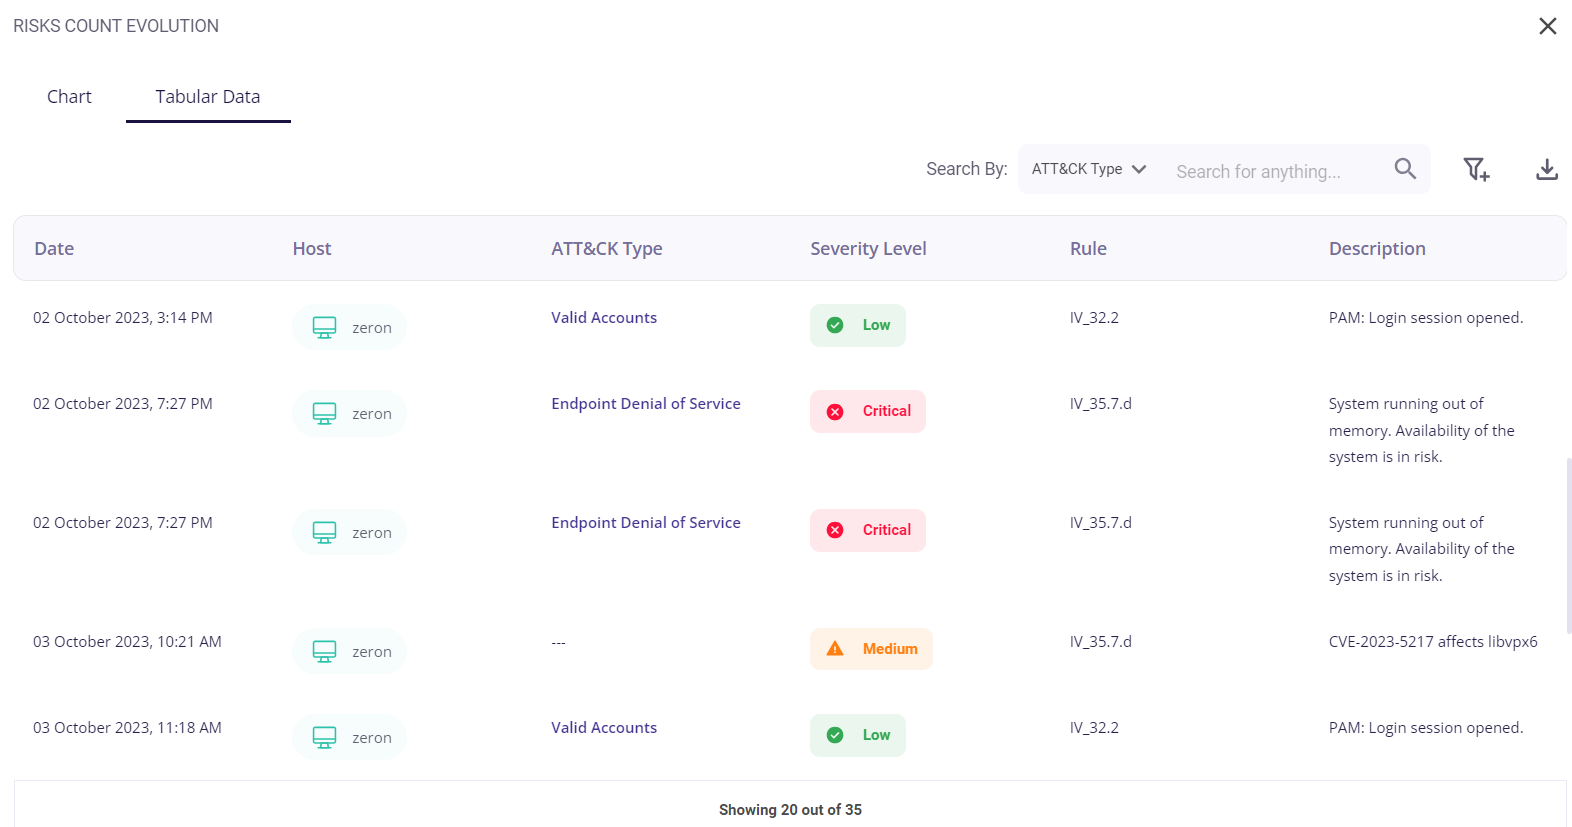
The tabular view provides the following info about the events through which the risks were detected:
- Date and time of occurrence
- Host
- MITRE ATT&CK type
- Security level (low/medium/high)
- Rule
- Description of the detected risk
The user can search for a particular event based on the Att&ck type, Description, or Rule by clicking on the filter icon in the top right corner. A list of the events can be downloaded as a .csv file by clicking on the download button and then selecting the 'export as .csv' option, and the total number of events is given at the bottom of the table.
Clicking on the date of a particular event would provide the user with further details about it.
Clicking on the MITRE ATT&CK type of a particular event would redirect the user to the Risk Mitigation page, where he/she is provided with the details about that risk and can create cybersecurity initiatives corresponding to that particular risk.
You can read more about the Risk Mitigation page here.

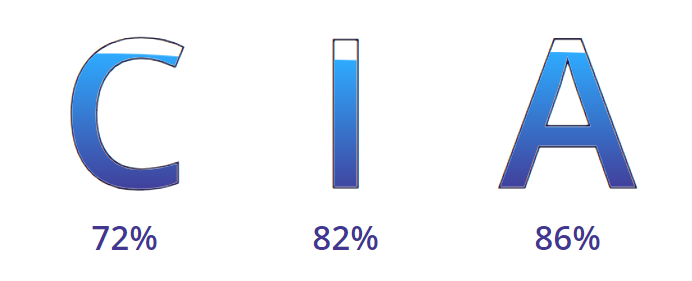
CIA Triad Percentage
This block gives the CIA triad score based on the confidentiality, integrity, and availability of the data.
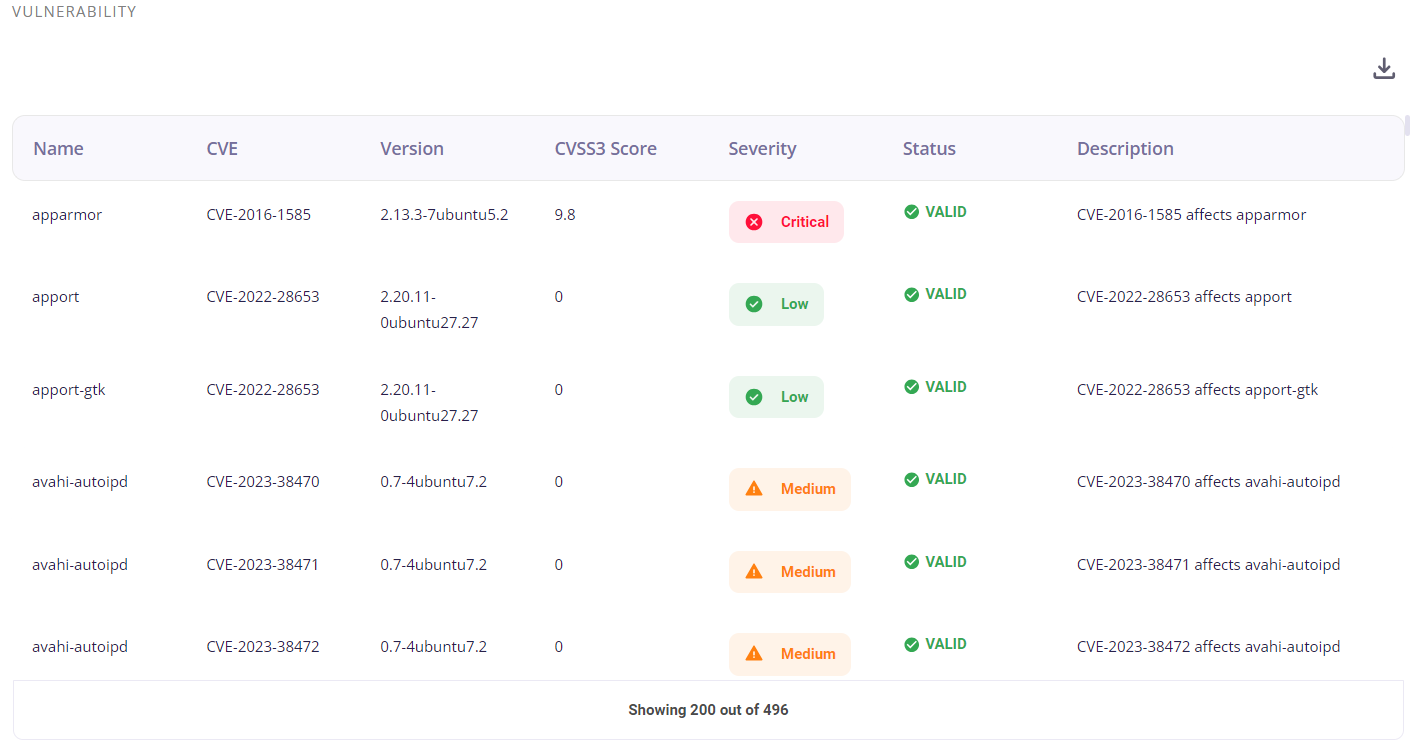
Vulnerabilities detected
This block consists of the list of detected vulnerabilities and provides the following info about the events through which they were detected:
- Name of the vulnerability
- CVE associated with the vulnerability
- Version of the service
- CVSS3 Score
- Security level (low/medium/high)
- Status
- Description
A list of the vulnerabilities can be downloaded as a .csv file by clicking on the download button and then selecting the 'export as .csv' option, and the total number of events is given at the bottom of the table.
Clicking on the date of a particular event would provide the user with further details about it.
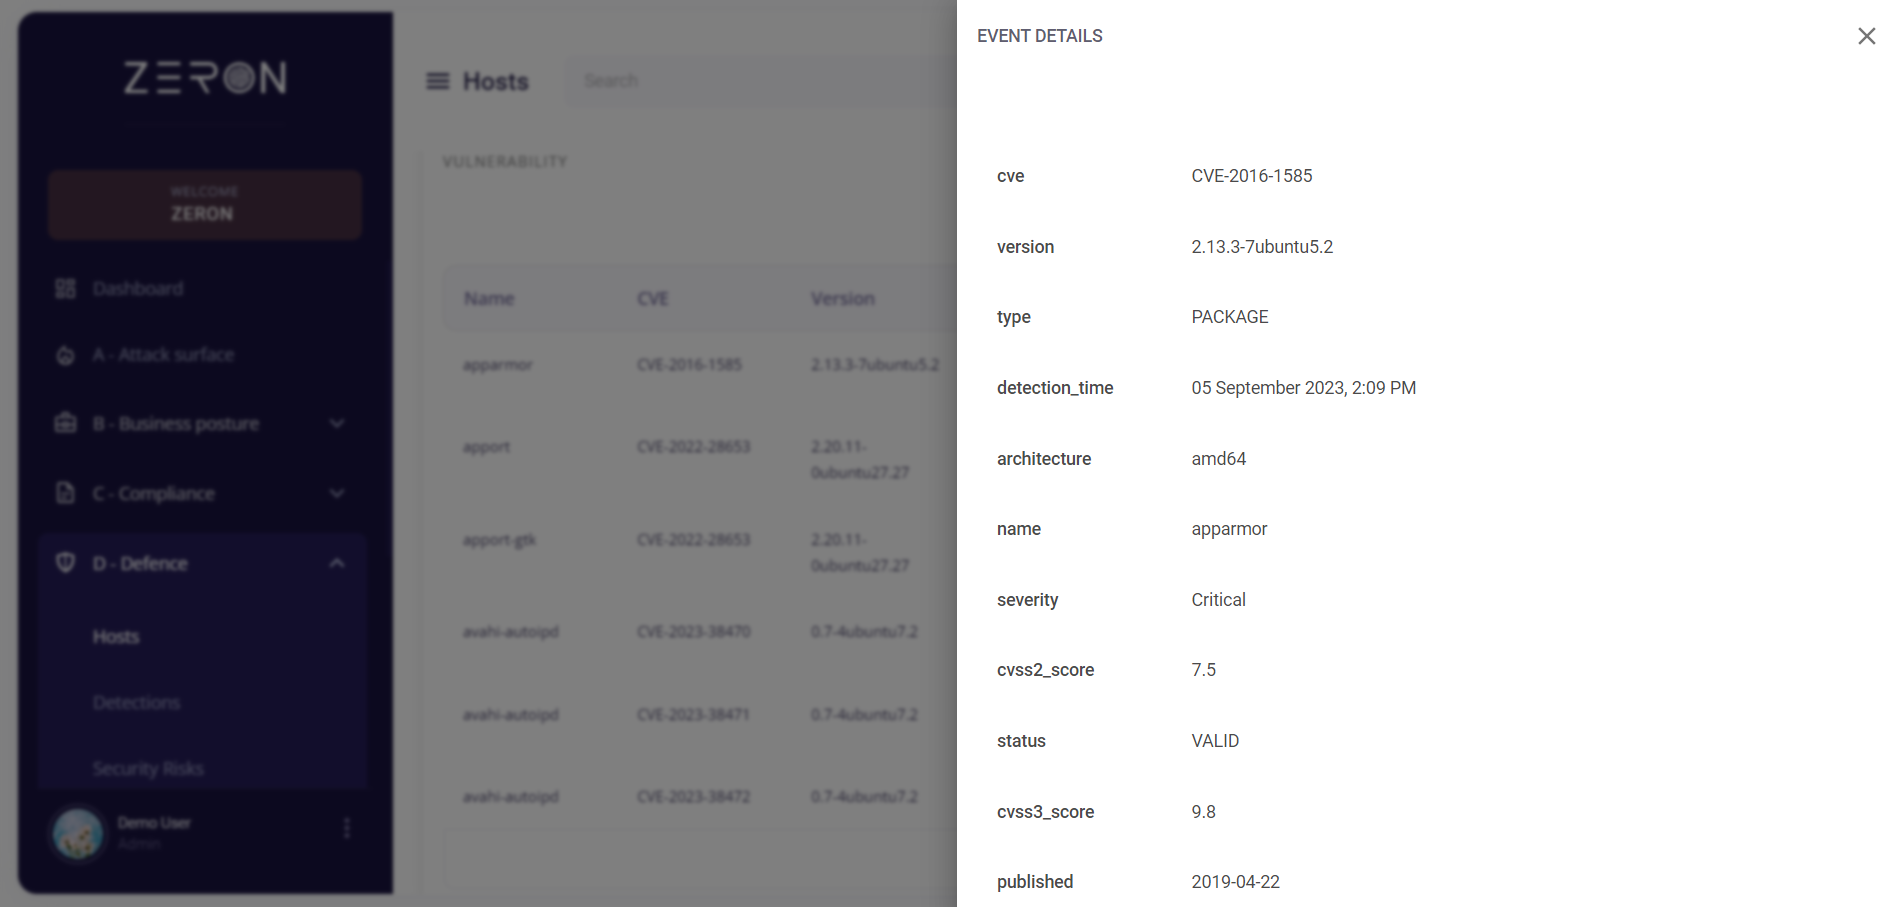
A CVSS3 score is the summation of three metric groups, being your Base, Temporal, and Environmental levels. A high CVSS3 score indicates a critical vulnerability.
Risks detected
This section consists of the list of detected risks and provides the following info about the events through which they were detected:
- Date and time of occurrence
- Host
- MITRE ATT&CK type
- Security level (low/medium/high)
- Rule
- Description of the detected risk
A list of the risks can be downloaded as a .csv file by clicking on the download button and then selecting the 'export as .csv' option, and the total number of events is given at the bottom of the table.
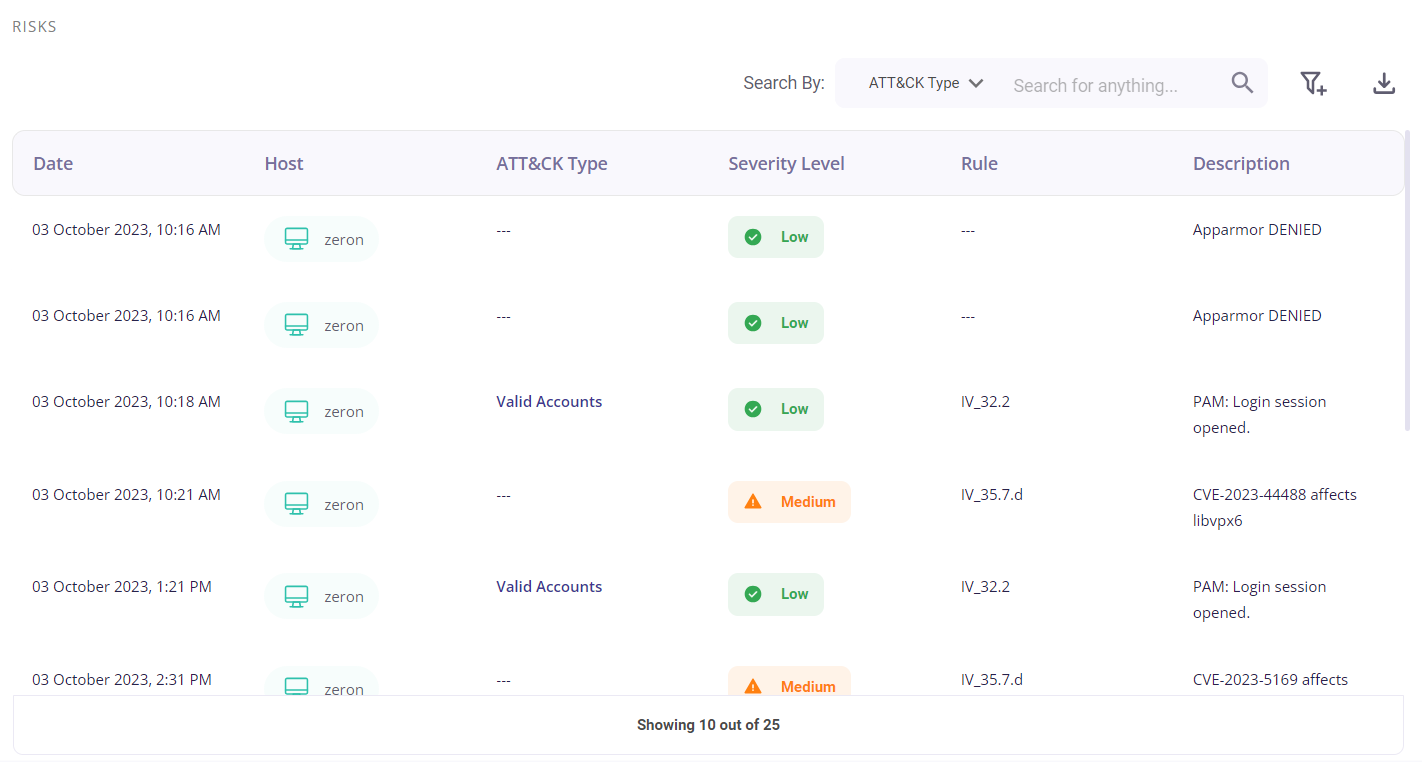
Clicking on the date of a particular event would provide the user with further details about it.
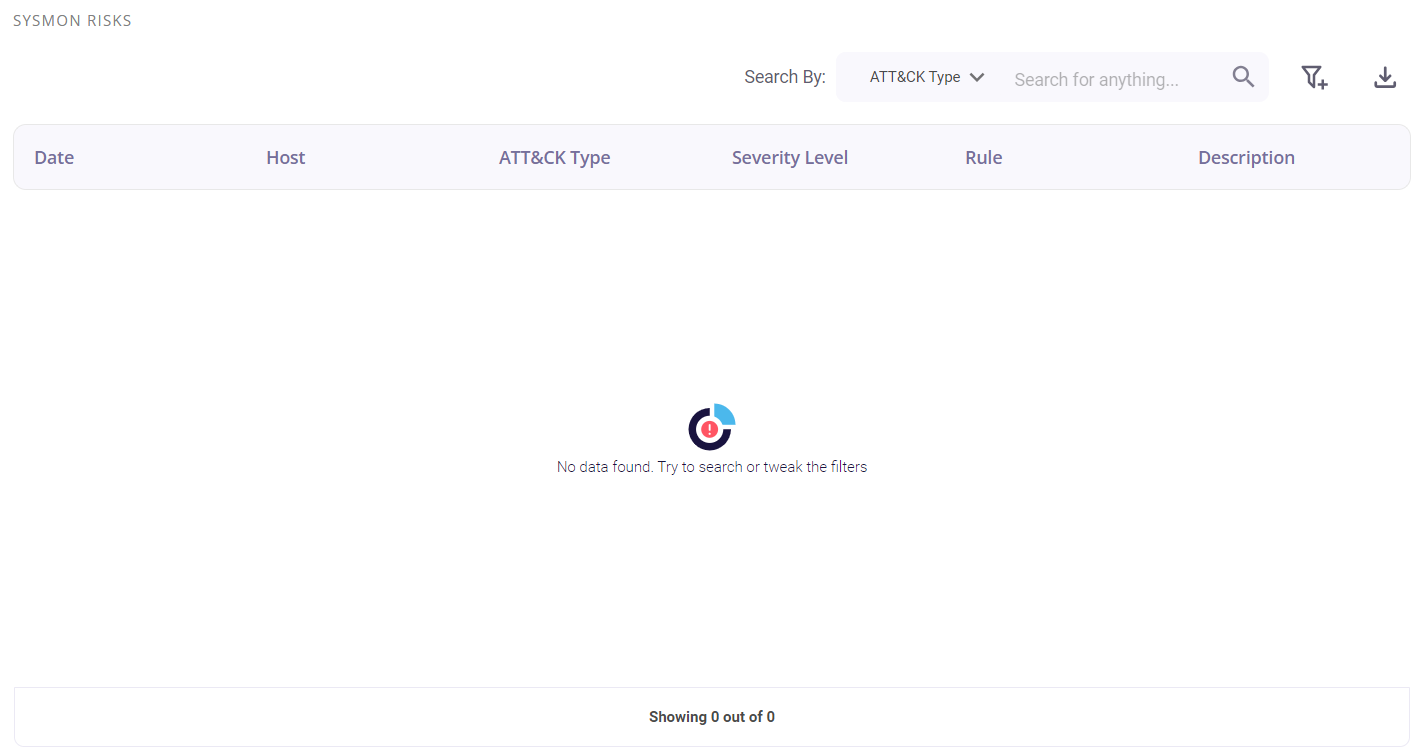
Sysmon risks detected