Security Risks
This page records the information regarding the Security risks linked to each host. It consists of the following blocks:
- Mitre Attack Techniques
- Threat Evolution
- Top Attack Hotspots
- File Integrity Monitoring
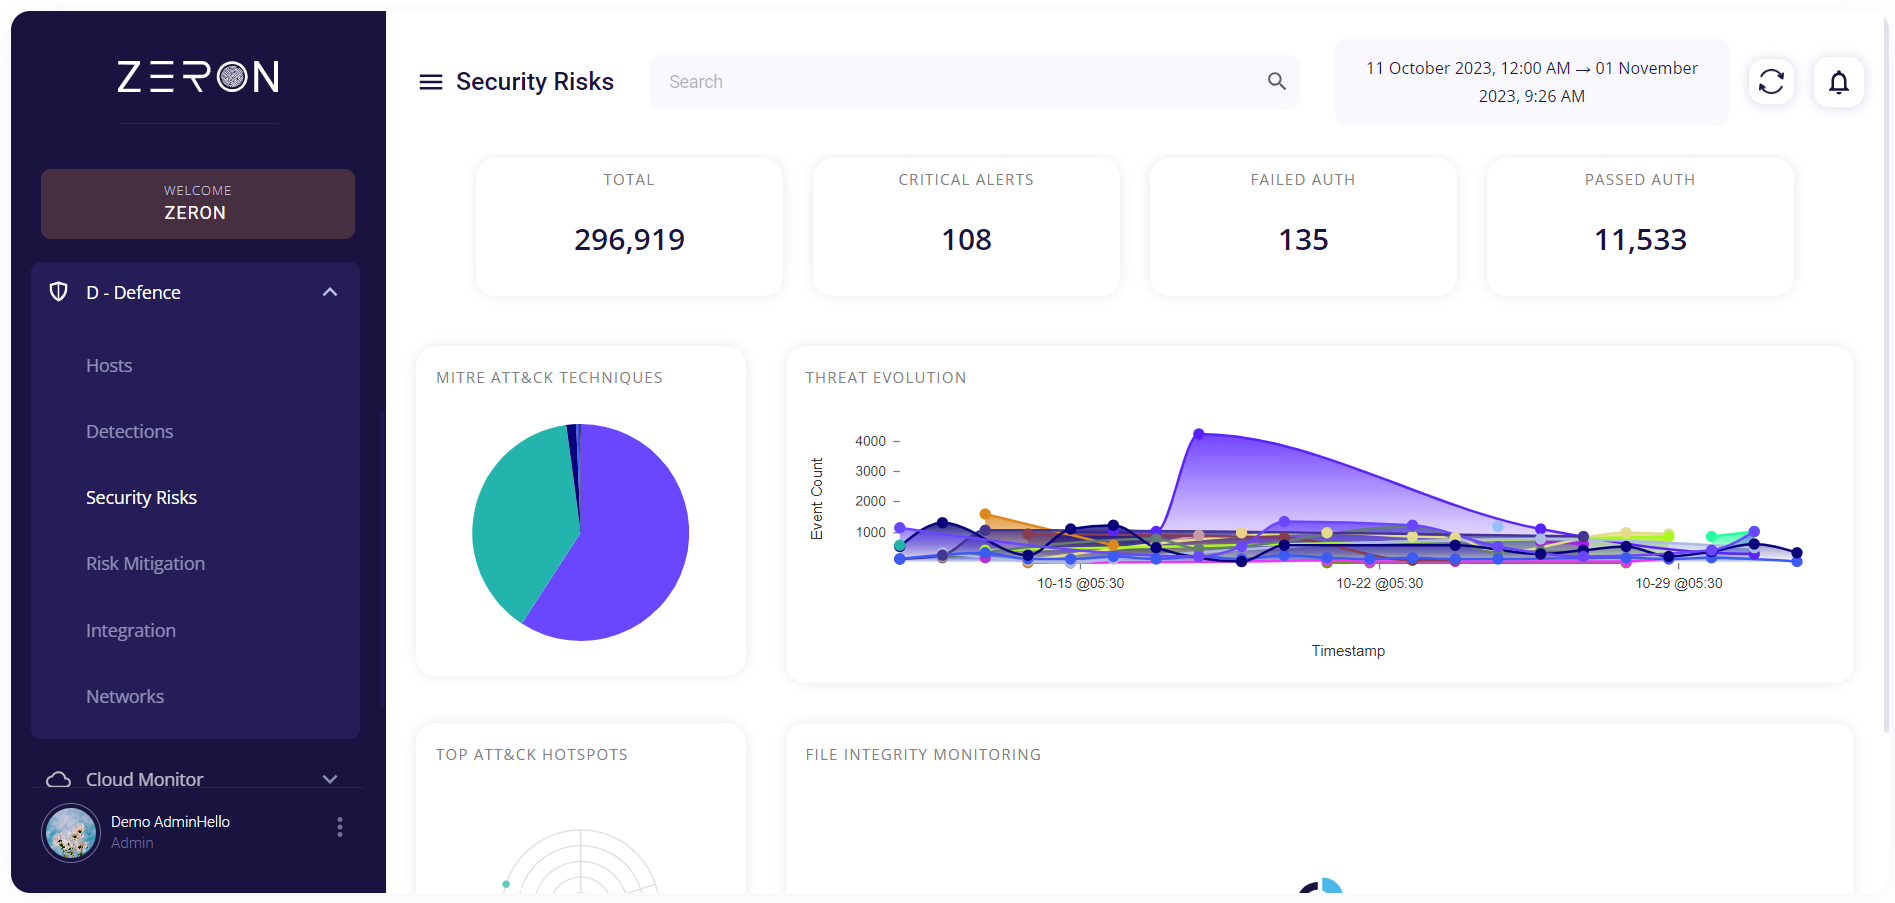
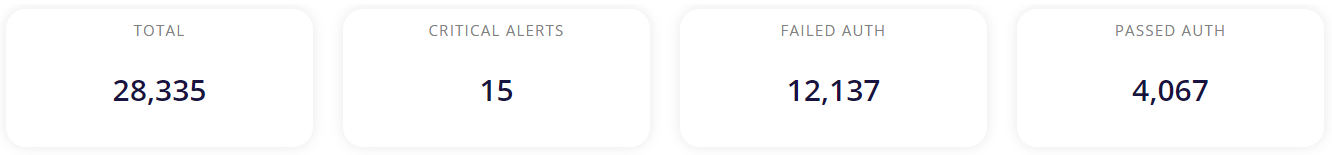
The top section of this page displays the following information regarding the detected risks:
- Total: Shows the total number of risks detected by Zensors in a certain timeframe.
- Critical alerts: Shows the number of risks with a severity level more than 12.
- Failed authentication: Shows the number of risks detected resulting in failed authentication.
- Passed authentication: Shows the number of risks detected resulting in successful authentication.
Mitre Attack Techniques
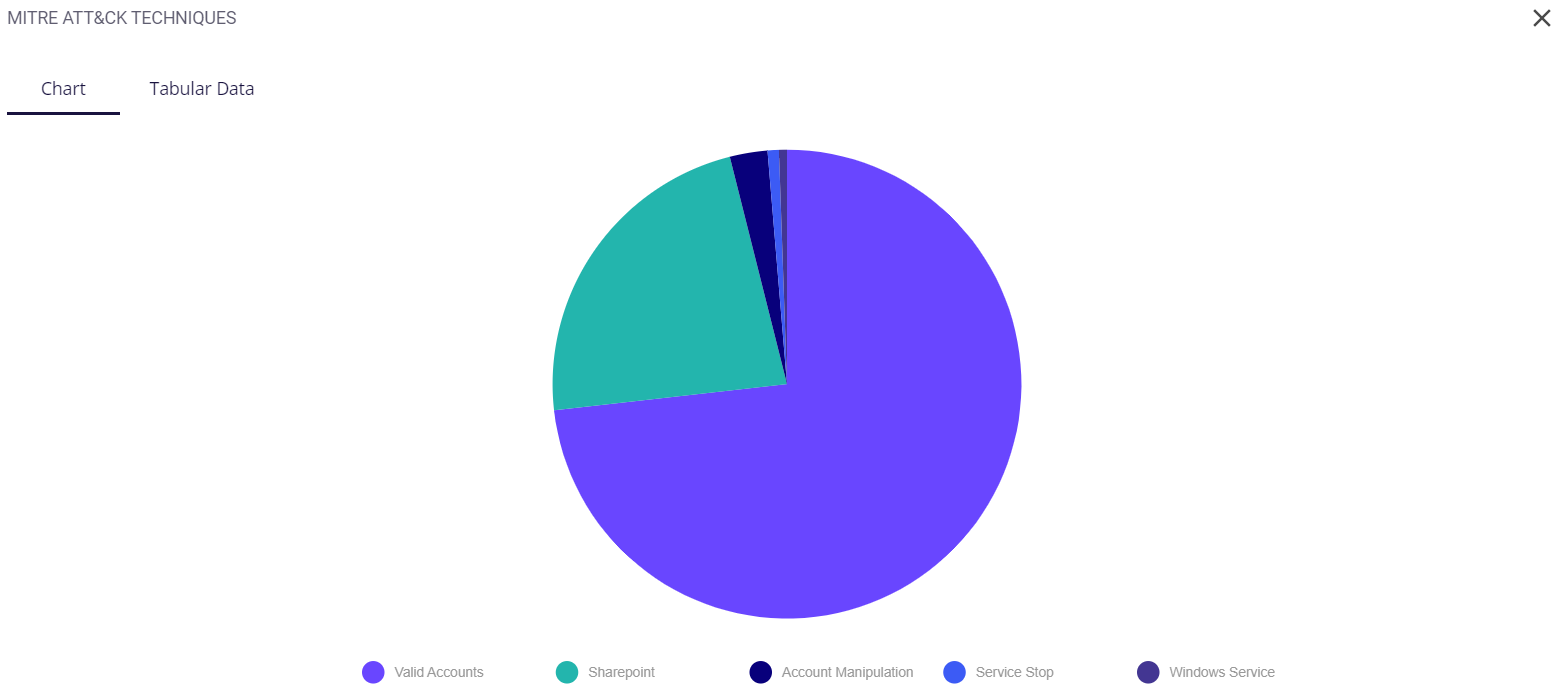
This block contains a pie chart which shows the different MITRE ATT&CK tactics risks detected across the organization. Each MITRE ATT&CK Technique has its own unique color assigned to it. Hovering over a particular color of the chart provides the user with the name of the technique and the number of tactics found under it. Clicking on the full-screen icon on the bottom right of this block provides the user with an enlarged chart view and a tabular view of the same.
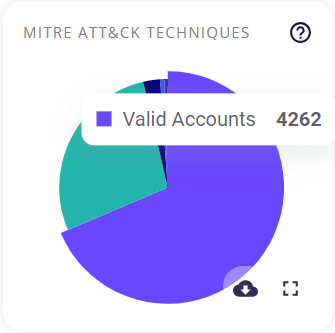
The key/legend of the chart is provided in the full-screen view, using which the user can map the techniques to their respective colors. Similar to the preview, hovering over a particular color of the chart provides the user with the name of the technique and the number of risks detected for it.
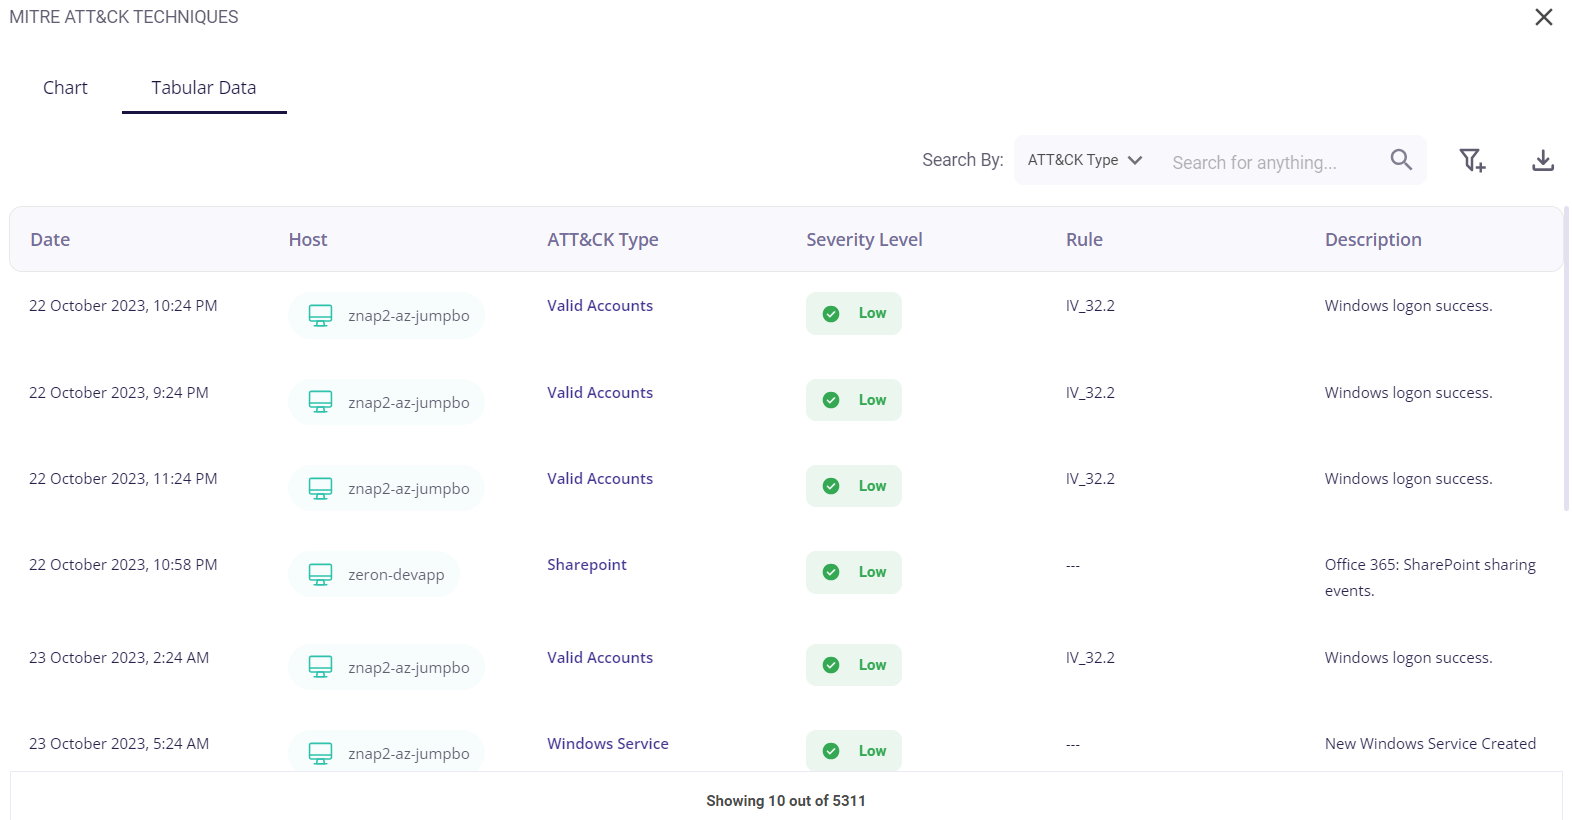
The tabular view provides the following info about the events through which the risks were detected:
- Date and time of occurrence
- Host
- MITRE ATT&CK type
- Security level (low/medium/high)
- Rule
- Description of the detected risk
The user can search for a particular event based on the host or severity level by clicking on the filter icon in the top right corner. A list of the events can be downloaded as a .csv file by clicking on the download button and then selecting the 'export as .csv' option, and the total number of events is given at the bottom of the table.
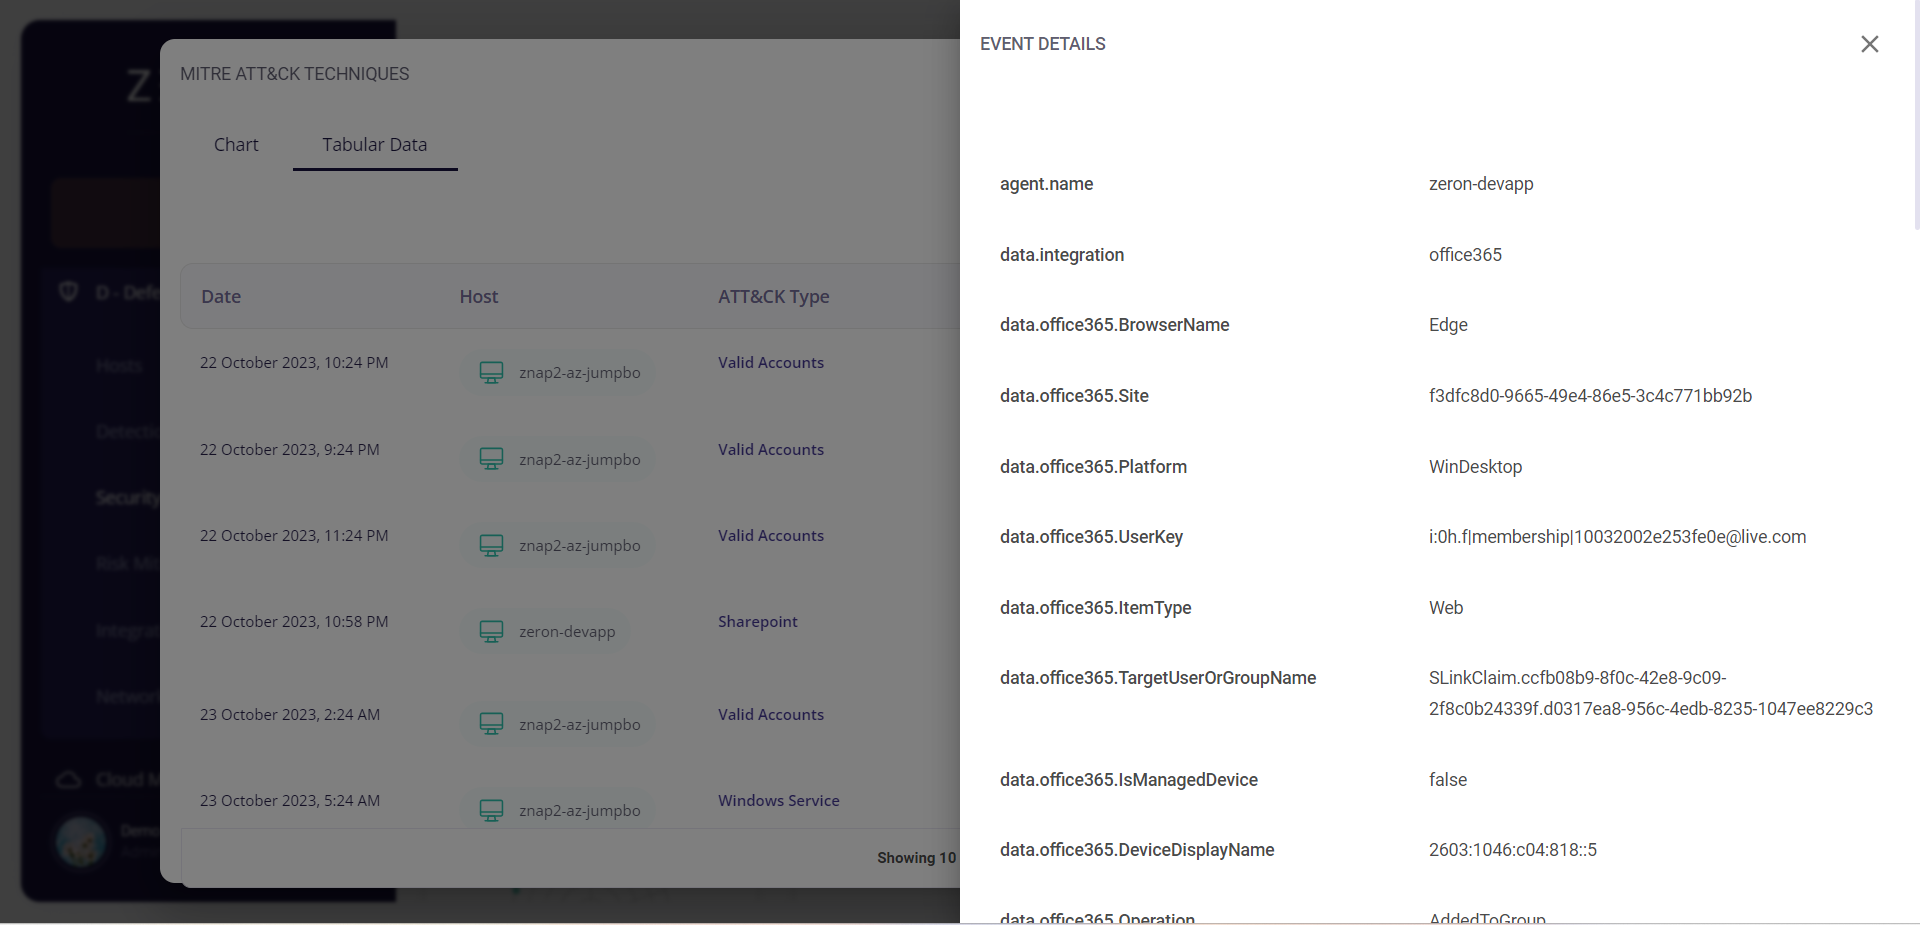
Clicking on a particular event would provide the user with further details about it.
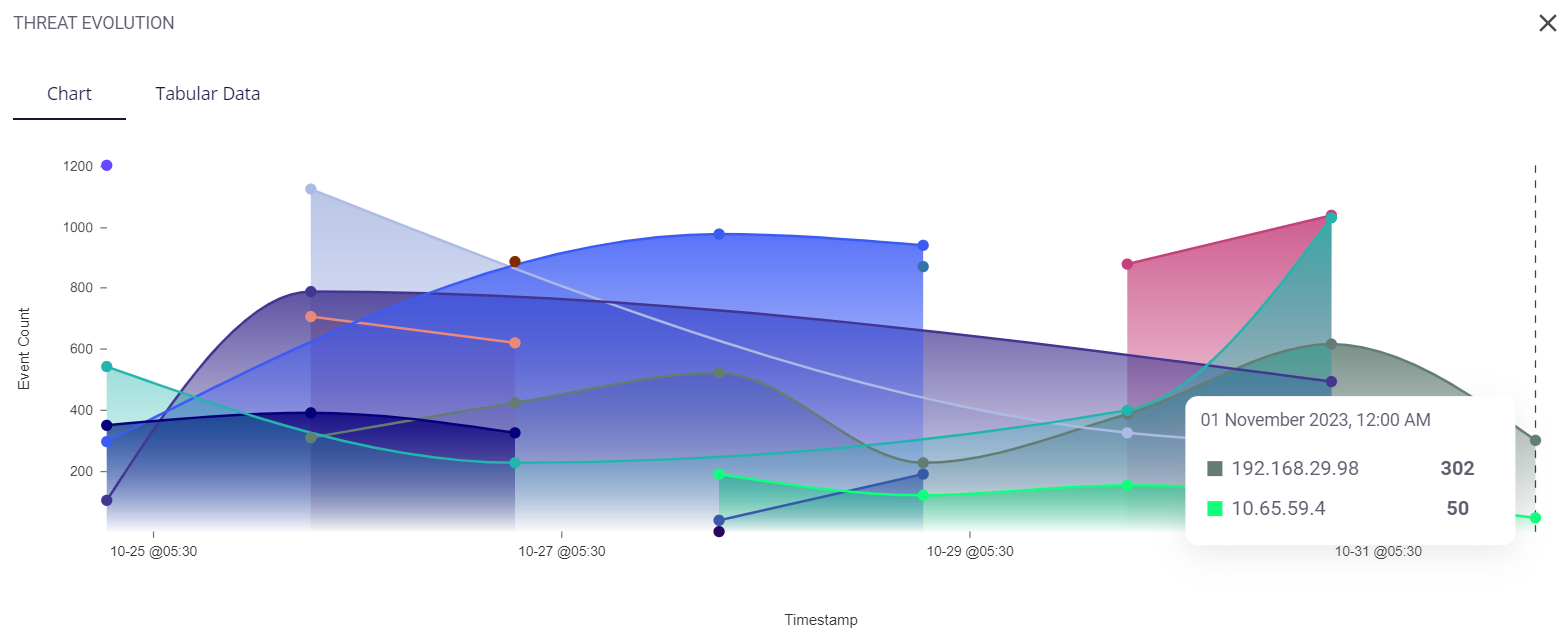
Threat Evolution
This block depicts the evolution of the threat landscape over time by giving a graphical representation of the risks detected. The graph is produced by plotting the event count of each host against its timestamp. Hovering over a particular color in the graph will display the number of events occurred at that time for each host, assort them, and color code them according to the IP address of the host. Clicking on the full-screen icon on the bottom right of this block provides the user with an enlarged view and a tabular view of the same.
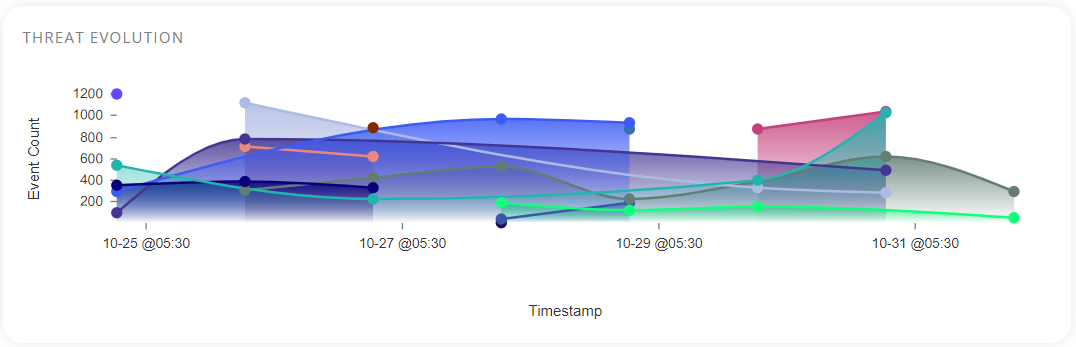
Similar to the preview, hovering over a particular color of the graph provides the user with the timestamp at that point and the number of events that occurred for each host at that time. The host IP addresses are color-coded.
The tabular view provides the following info about the events through which the risks were detected for each host:
- Date and time of occurrence
- Host
- MITRE ATT&CK type
- Security level (low/medium/high)
- Rule
- Description of the detected risk
The user can search for a particular event based on the host or severity level by clicking on the filter icon in the top right corner. A list of the events can be downloaded as a .csv file by clicking on the download button and then selecting the 'export as .csv' option, and the total number of events is given at the bottom of the table.
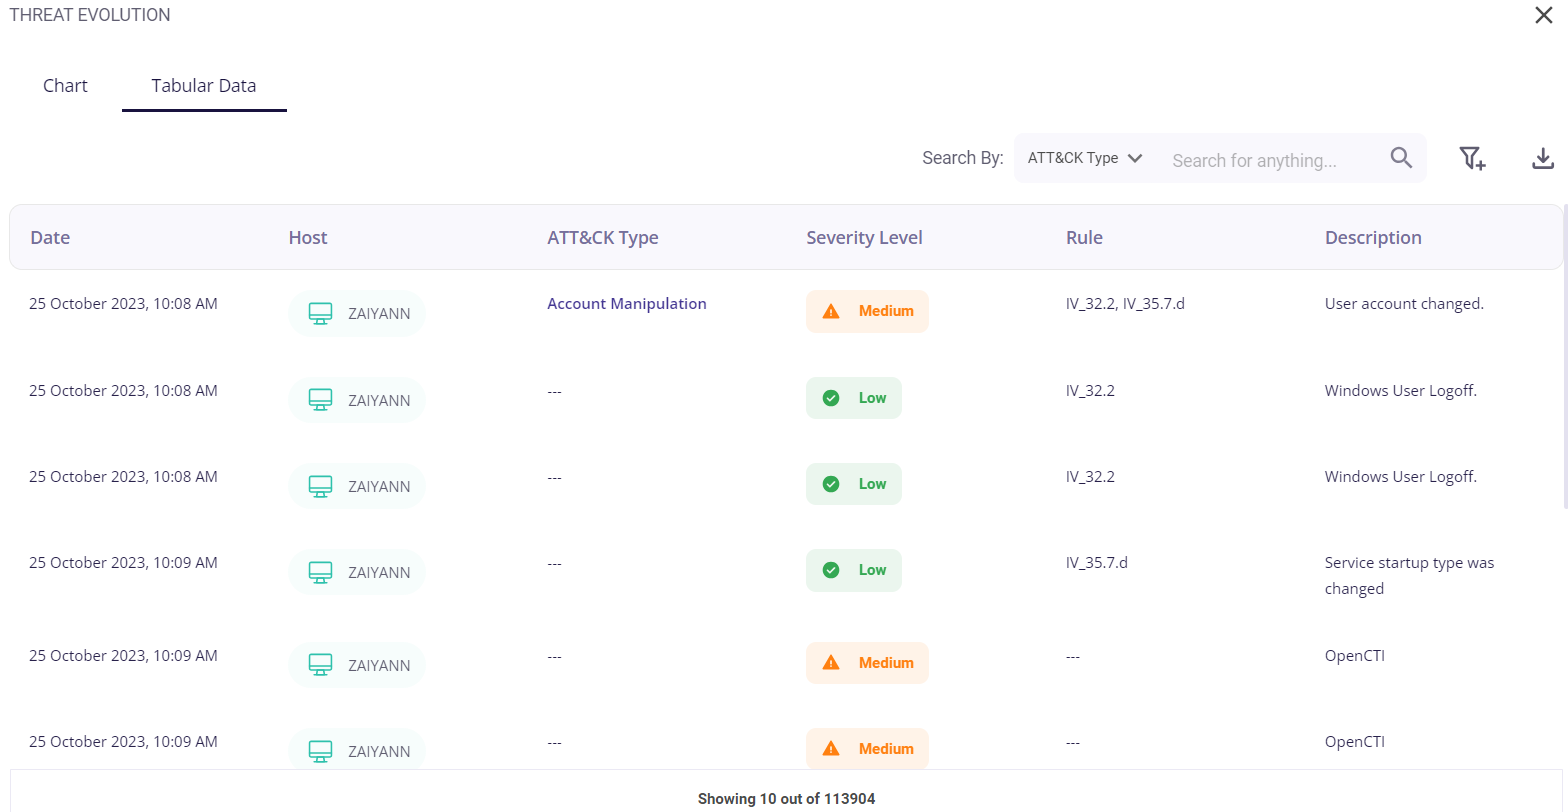
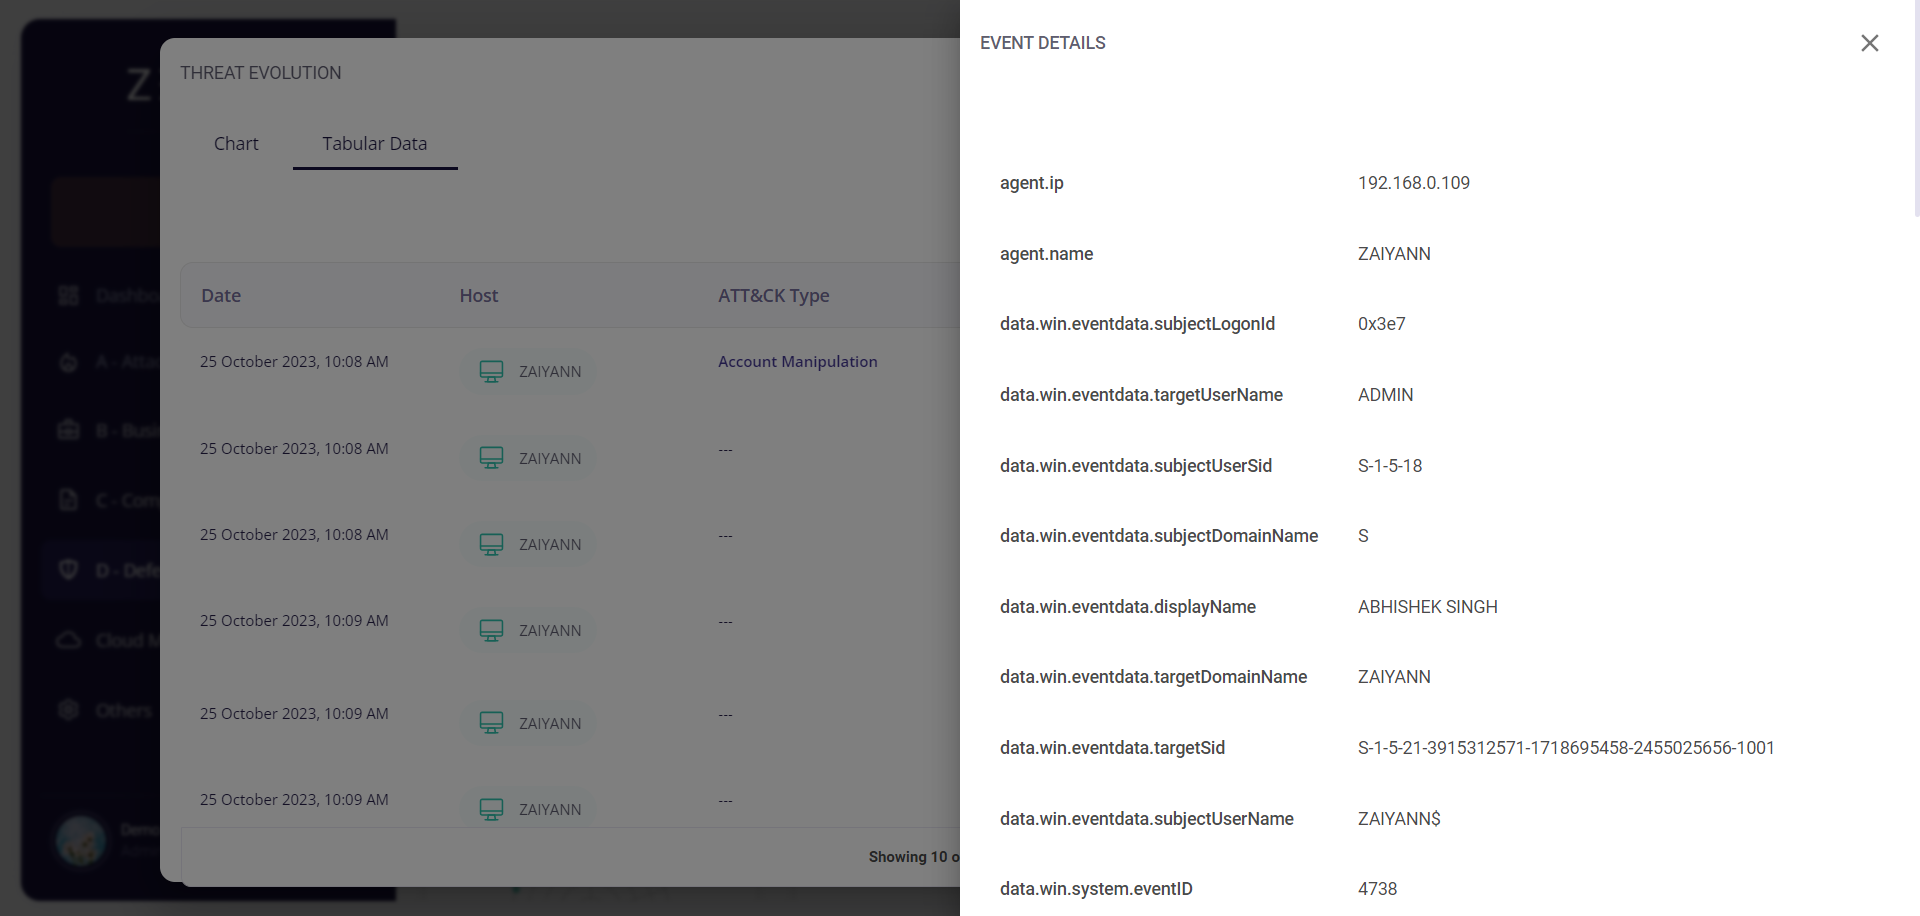
Clicking on the date of a particular event would provide the user with further details about it.
Clicking on the MITRE ATT&CK type of a particular event would redirect the user to the Risk Mitigation page, where he/she is provided with the details about that risk and can create cybersecurity initiatives corresponding to that particular risk.
You can read more about the Risk Mitigation page here.

Top Attack Hotspots
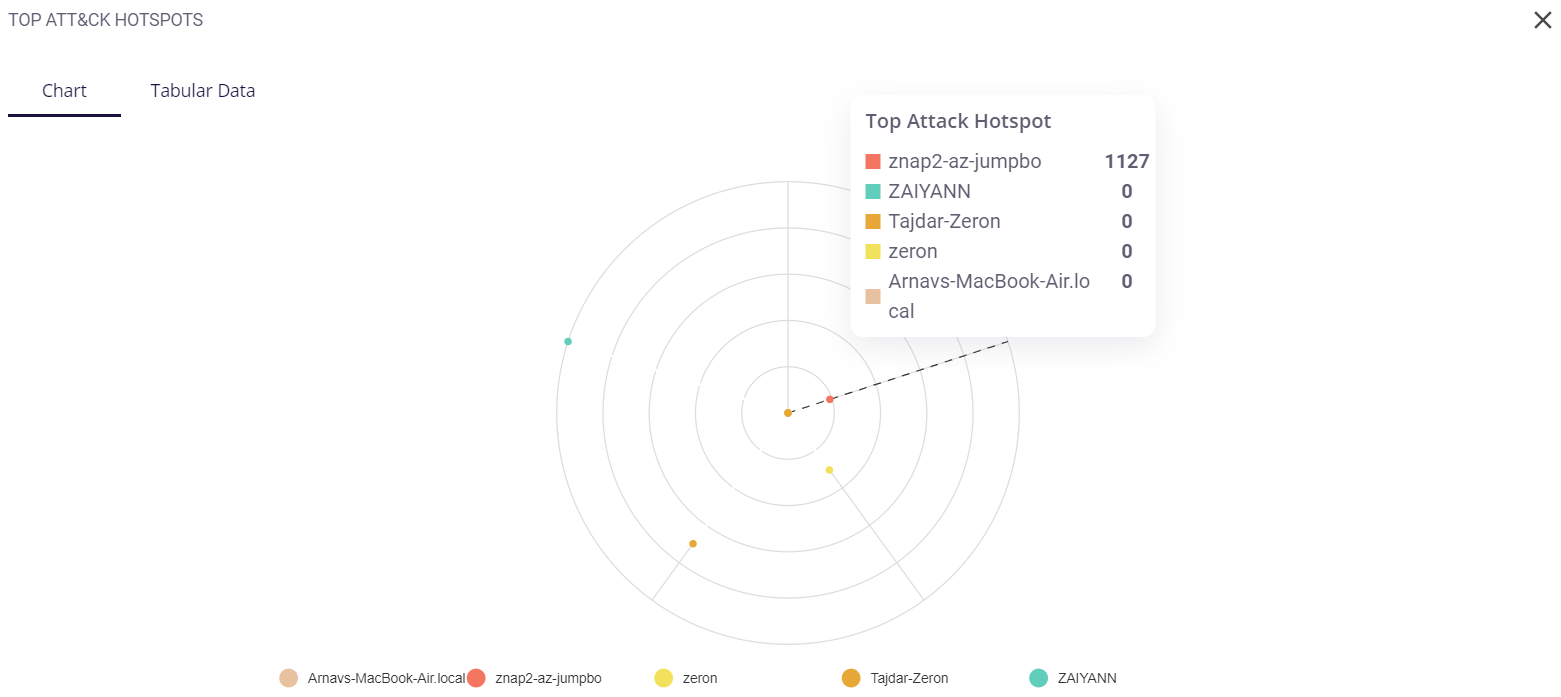
This block consists of a web chart that shows how exposed the hosts in the organization are to an attack. Each host is color-coded, and hovering over a particular section of the chart will display the top attack hotspot (most targeted host) in that section, and also show its event count. Clicking on the full-screen icon on the bottom right of this block provides the user with an enlarged chart view and a tabular view of the same. Two of the most exposed hosts are given at the bottom.
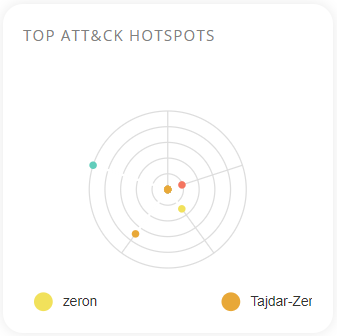
The key/legend of the chart is provided in the full-screen view, using which the user can map the hosts to their respective colors. Similar to the preview, hovering over a particular section of the chart provides the user with the top attack hotspot and its event count.
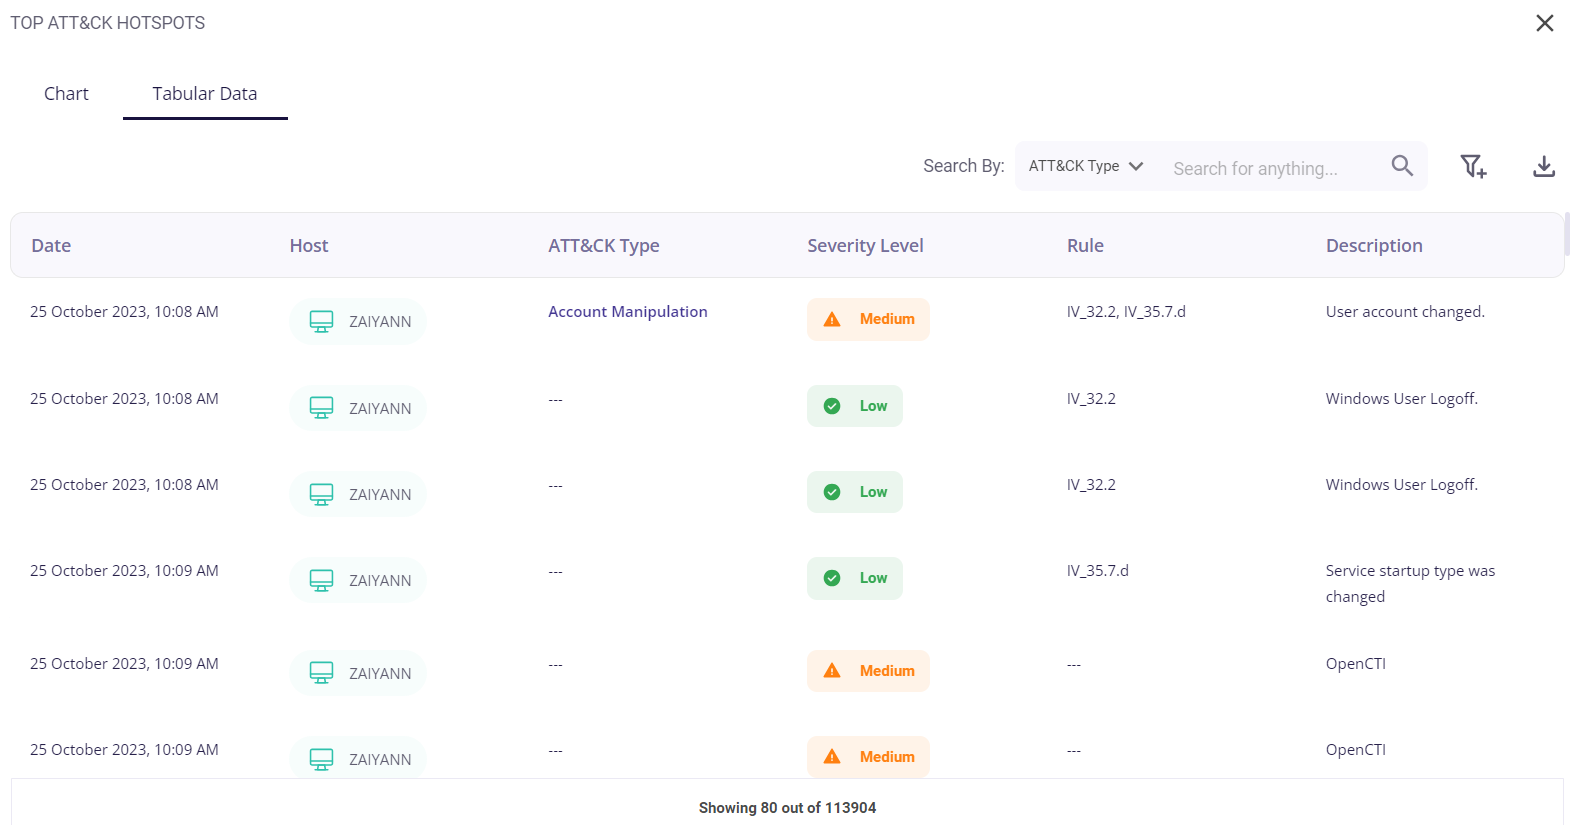
The tabular view provides the following info about the events through which the risks were detected for each host:
- Date and time of occurrence
- Host
- MITRE ATT&CK type
- Security level (low/medium/high)
- Rule
- Description of the detected risk
The user can search for a particular event based on the host or severity level by clicking on the filter icon in the top right corner. A list of the events can be downloaded as a .csv file by clicking on the download button and then selecting the 'export as .csv' option, and the total number of events is given at the bottom of the table.
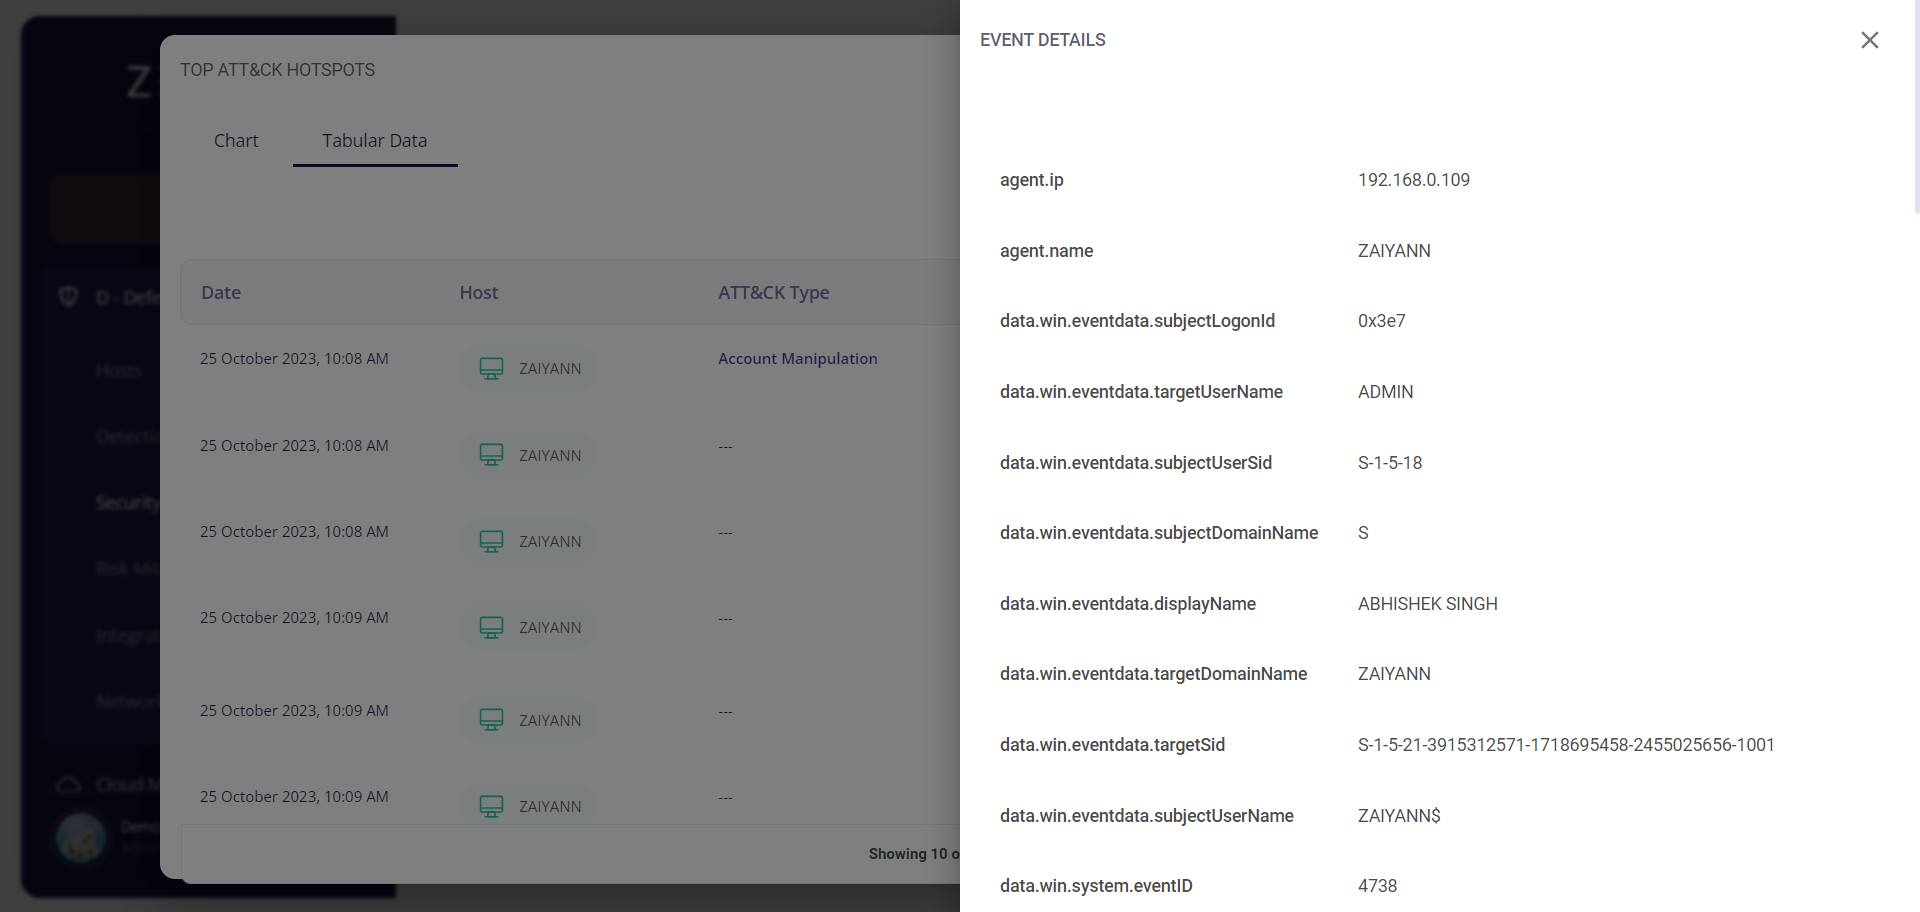
Clicking on the date of a particular event would provide the user with further details about it.
Clicking on the MITRE ATT&CK type of a particular event would redirect the user to the Risk Mitigation page, where he/she is provided with the details about that risk and can create cybersecurity initiatives corresponding to that particular risk.
You can read more about the Risk Mitigation page here.

File Integrity Monitoring
This block displays the integrity of files in the system by recording the number of times they have been modified, added, or deleted.