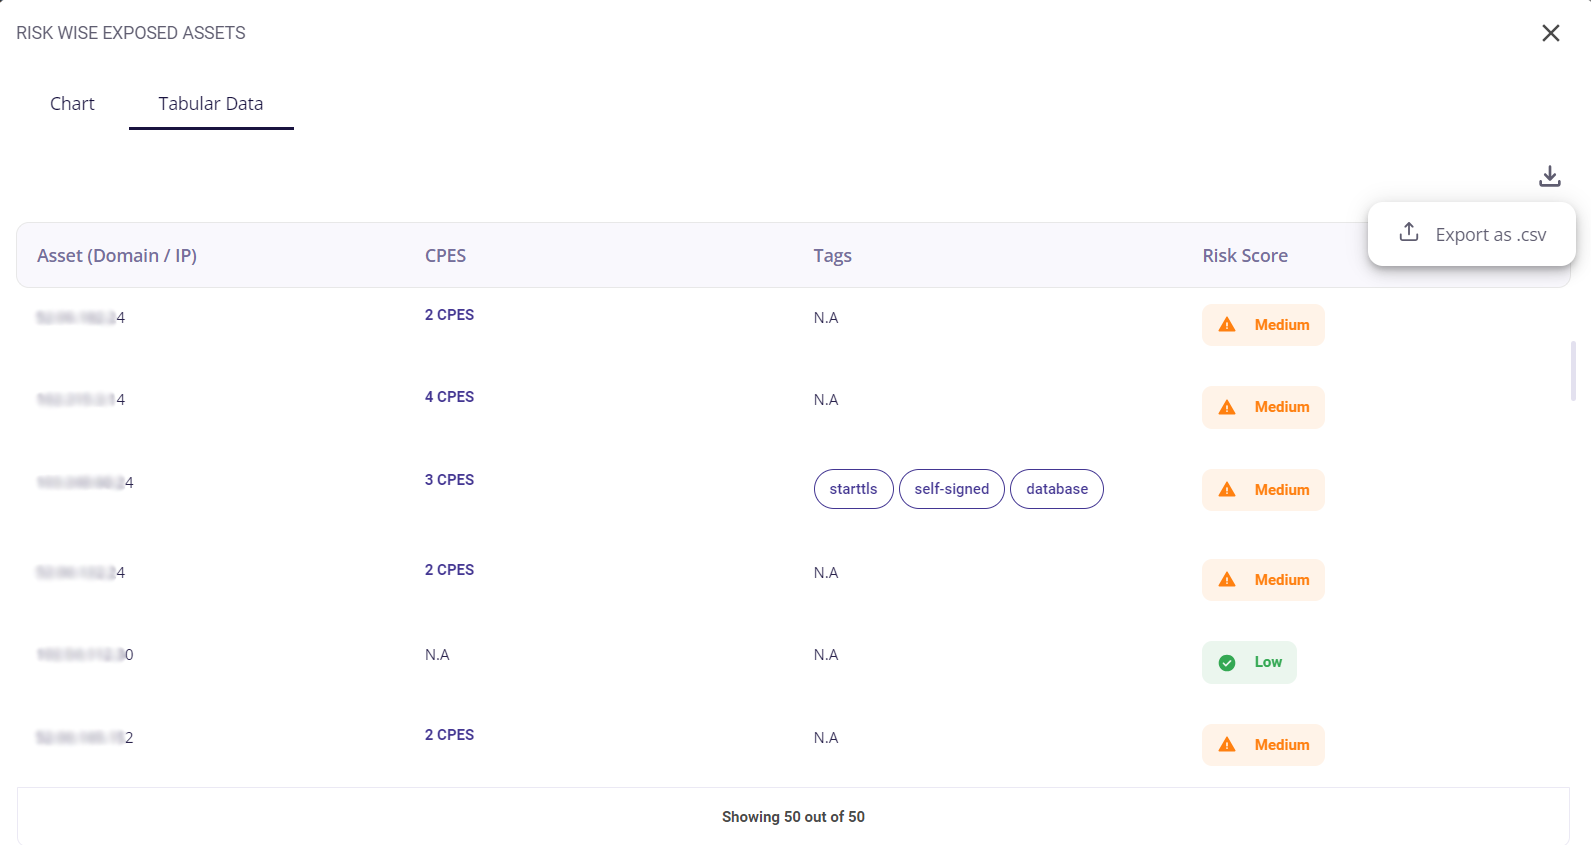
Risk Wise Exposed Assets
This block contains a donut chart that visually depicts the exposed assets while categorizing them based on the severity of the risk. Hovering over a particular colour of the chart provides the user with the number of assets exposed. Clicking on the full-screen icon on the bottom right of this block provides the user with an enlarged chart view and a tabular view of the same.
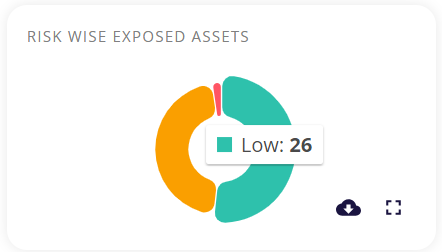
The key/ legend of the chart is provided in the full-screen view. The green, orange, and red sections of the chart refer to low, medium, and high risk respectively.
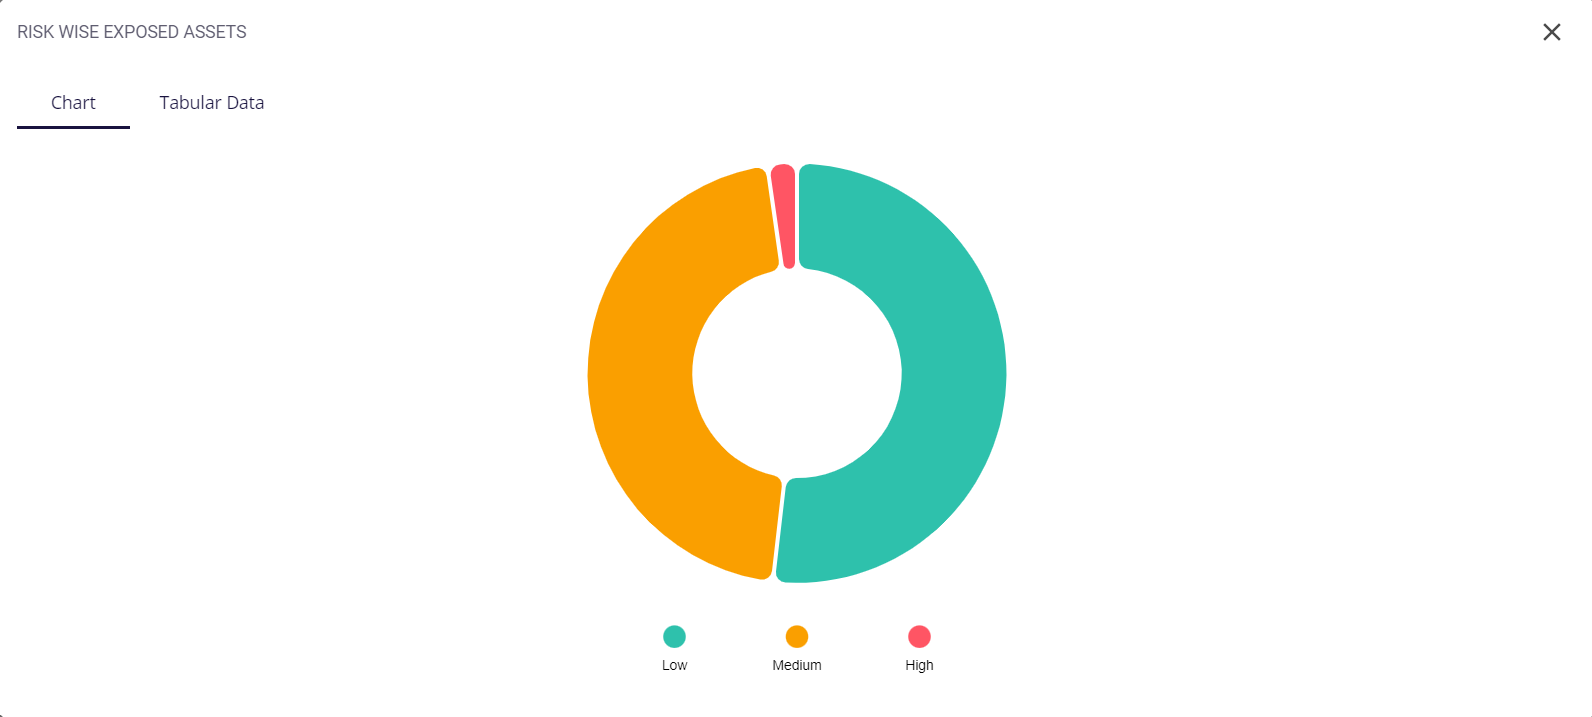
The tabular view provides the following info about the assets:
- Domain name
- Number CPEs applicable to each domain
- Tags associated with it
- Its risk score (low, medium, or high).
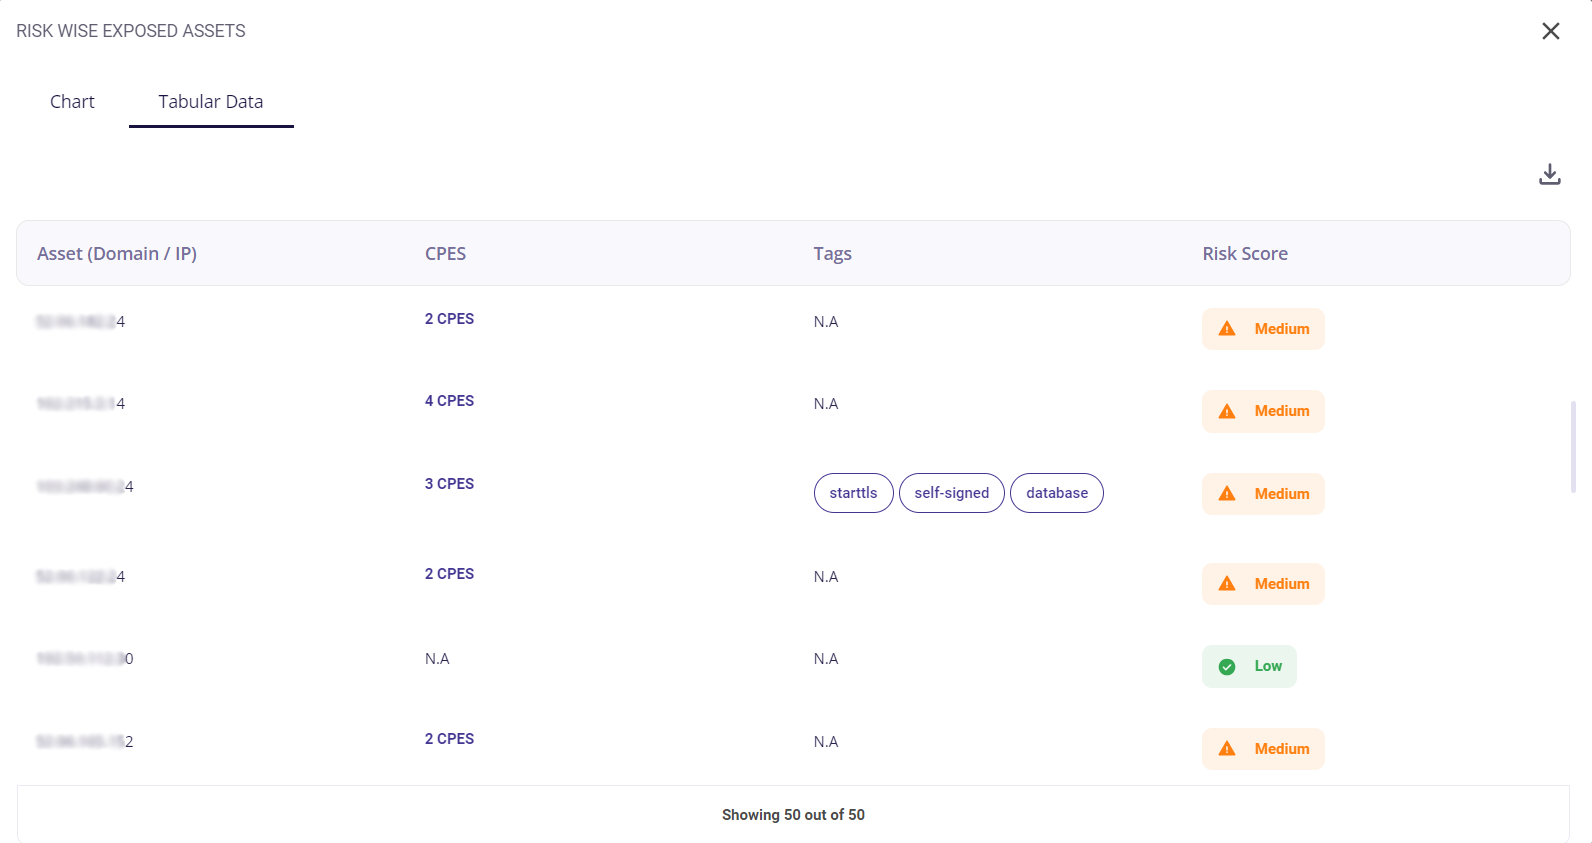
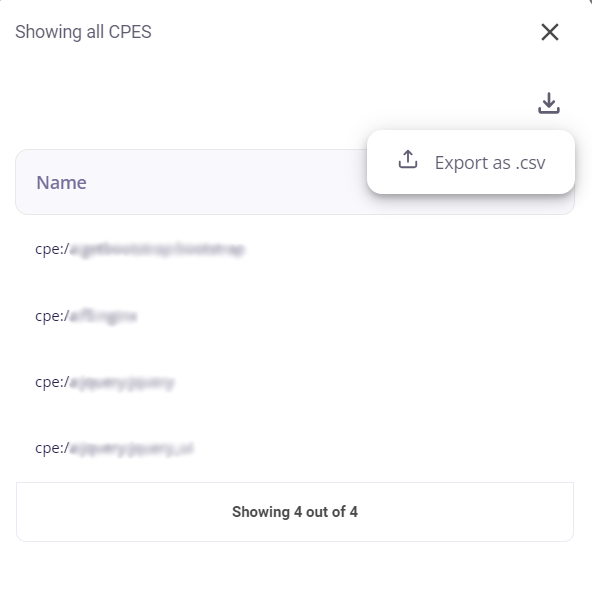
Clicking on the number of CPEs opens a list of the CPEs suggested. This list can be downloaded as a .csv file, by clicking on the download icon.
| Aspect | CPES (Common Platform Enumeration) | CVEs (Common Vulnerabilities and Exposures) |
|---|---|---|
| Description | focuses on system configurations, detailing the setup and components of hardware and software. | specific identifiers assigned to vulnerabilities in software systems. These IDs are used to discuss and track security issues. |
| Example | Example CPES: cpe:/o:microsoft:windows:10 | Example CVE: CVE-2023-12345 |
| Focus | emphasizes identifying different system components and their versions. | highlight individual vulnerabilities within software systems, pinpointing security risks. |
| Use Case | used to determine affected systems based on configurations. | employed to reference and discuss vulnerabilities, enabling security conversations. |
| Link to Issues | associated with configuration data, aiding in assessing system setup. | directly linked to detailed information about vulnerabilities, assisting in risk assessment. |
| Mitigation Usage | helps identify impacted systems, allowing for targeted security measures. | provide information about specific vulnerabilities, aiding in devising mitigation plans. |
The total number of assets discovered can be seen at the bottom of the table. To download a .csv file of the tabular data containing all the details, the user can click on the download button present at the top right corner of the table.
