Findings
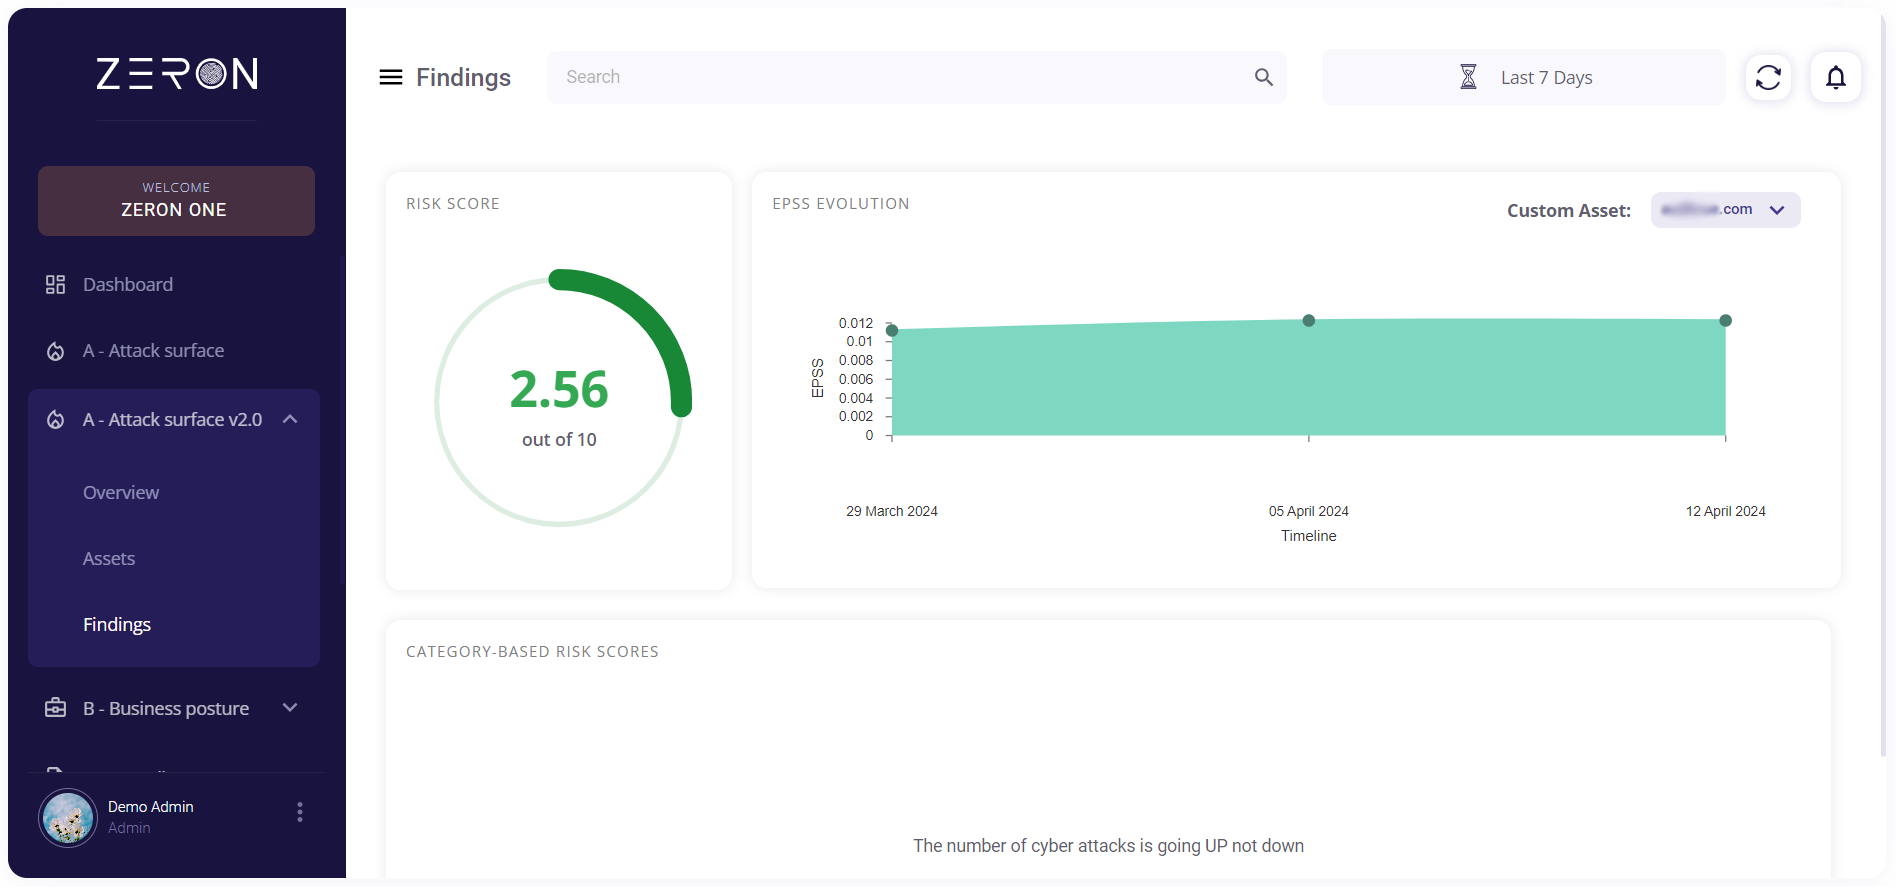
This page provides a summary of all the findings and provides different risk scores for different categories of risks. This page is made up of the following sections:
- Overall Risk Score
- EPSS Evolution
- Category based risk scores

Overall Risk Score
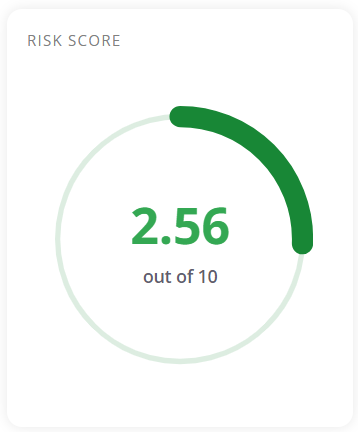
This section boasts a ‘risk score’, which is a numerical score provided to describe the risk level for all the assets overall. The higher the score the higher the risk (the area of the shaded region in the risk score chart is directly proportional to its value).

EPSS Evolution
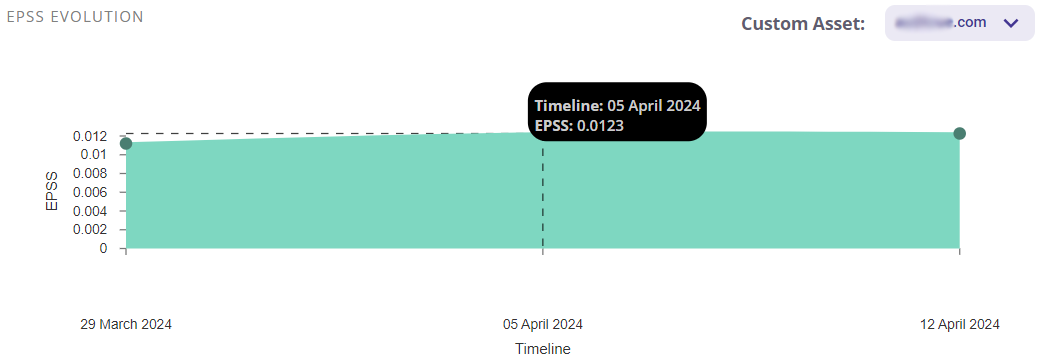
The Exploit Prediction Scoring System (EPSS) assesses the probability of a specific vulnerability being exploited in real-world scenarios. The EPSS evolution graph indicates changes in findings over time, reflecting whether there has been an increase or decrease. This information aids in prioritizing the mitigation and management of vulnerability findings accordingly. Hovering over this chart gives the user the EPSS score at that time.

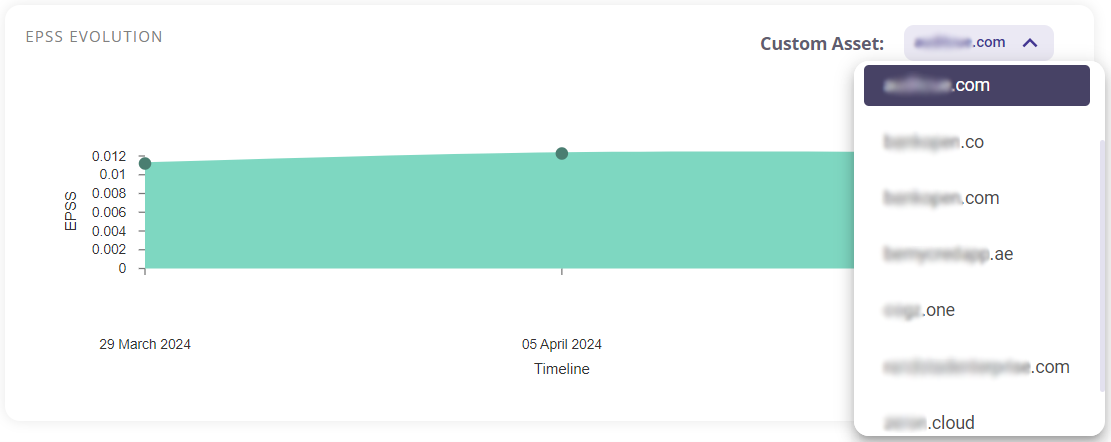
The custom asset dropdown menu at the top right corner of this block enables users to select the specific asset for which they want to generate the EPSS evolution graph.

Category based risk scores
In this section, the different categories of threats found applicable to the assets are shown. Each category is awarded a risk score based on the individual scores of all the assets.