Overview
This page acts as an outline to this module by providing all the primary aspects like domain statistics and threat wise asset classification in one screen. It is made of the of the following sections:
- Stats panel
- Attack Surface Evolution
- Domain Statistics
- Threat wise asset classification
- Asset discovery funnel
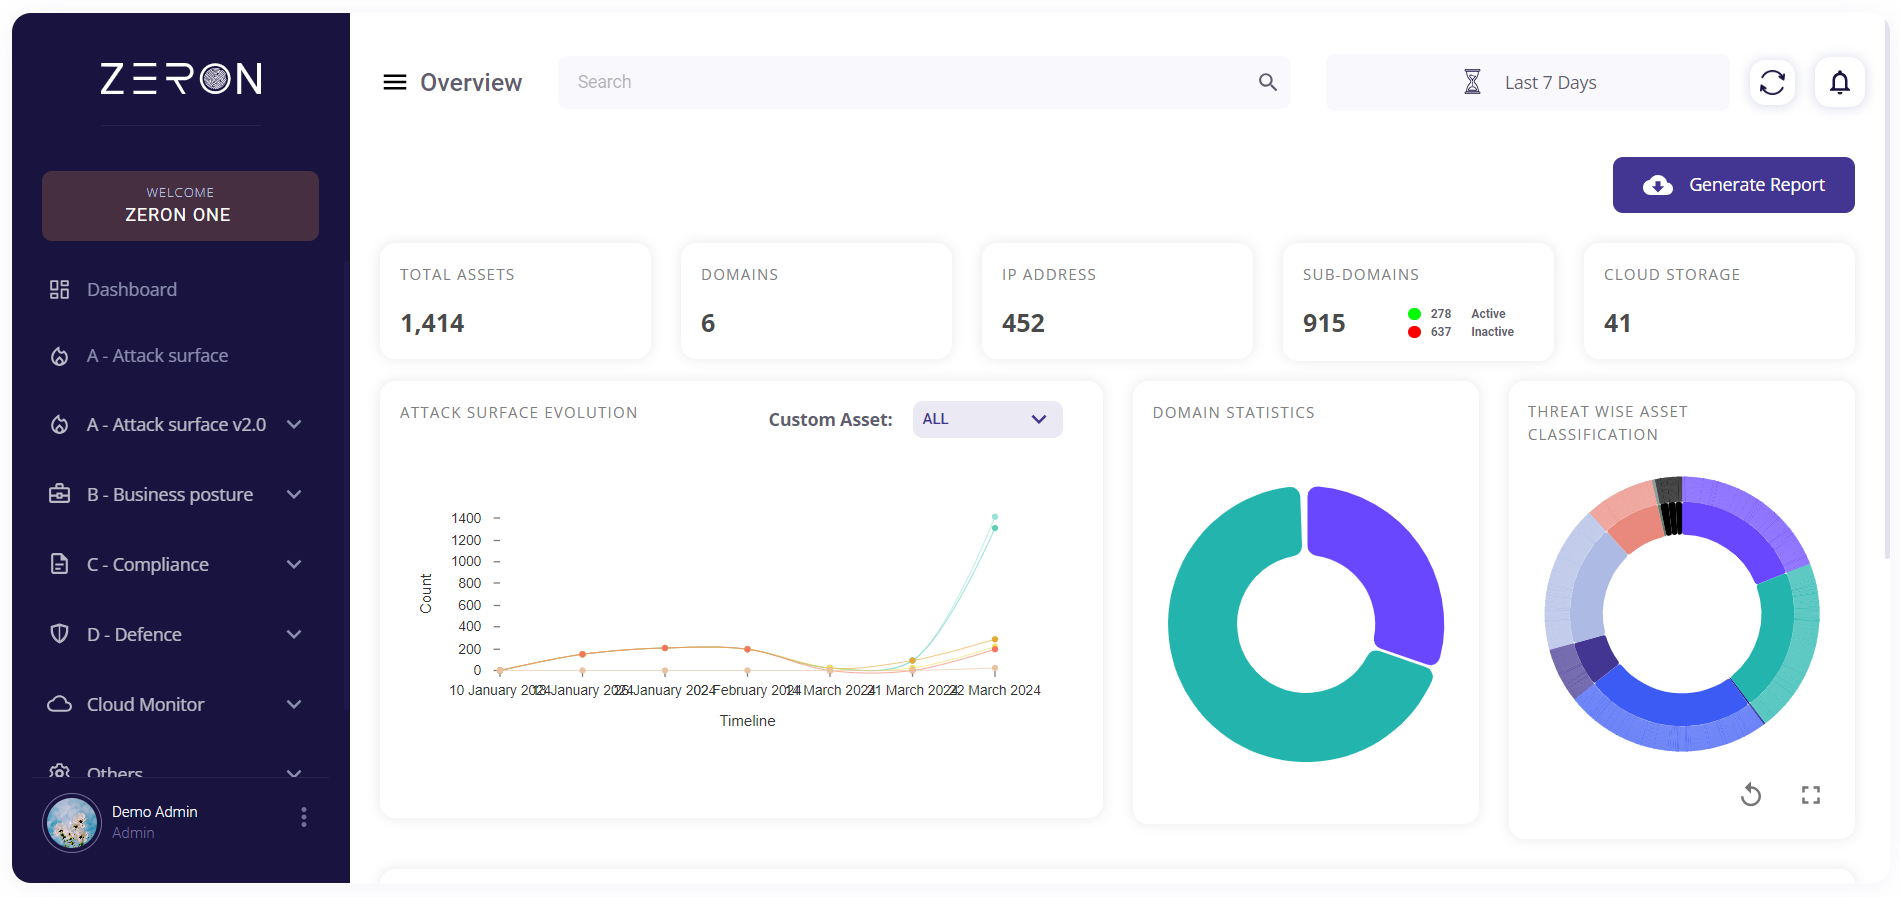
Stats Panel
The top part of the page consists of a stats panel which holds the following blocks:
- Total assets
- Domains
- IP Address
- Sub-Domains
- Cloud Storage
Each block within the Stats Panel offers insights into the corresponding asset category.

Total Assets: This block displays the total number of assets that have been discovered from the scans so far. Clicking on this block redirects the user to the assets page.

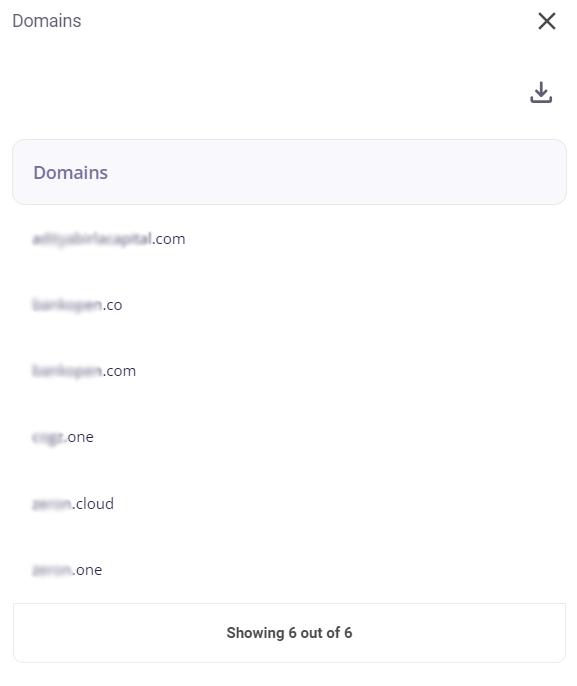
Domains: This block displays the total number of domains discovered so far.

Clicking on this block provides the user with the list of the domains. The total number of domains is also provided at the bottom of the list. This list can be downloaded as a .csv file by clicking on the download button at the top right corner and then pressing the ‘export as .csv’ option.
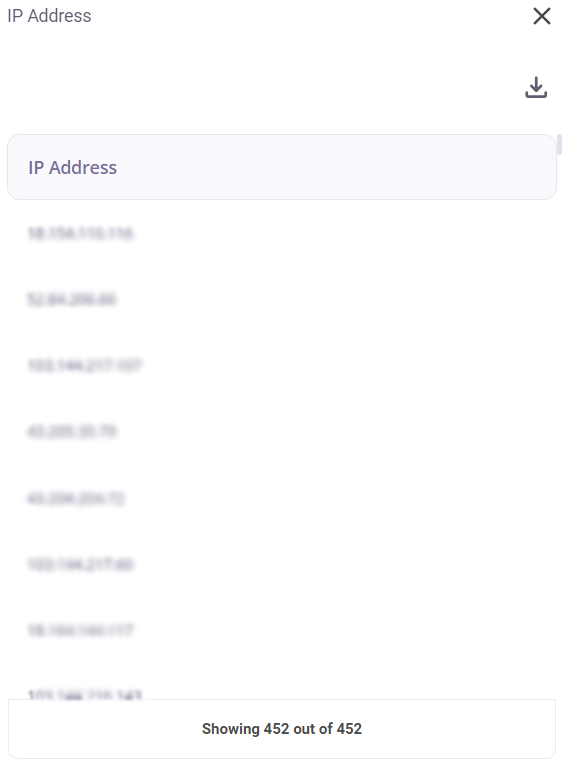
IP Address: This block displays the total number of IP addresses discovered so far. Clicking on this block provides the user with the list of IP addresses. The total number of IP addresses is also provided at the bottom of the list.

This list of IP Addresses can be downloaded as a .csv file by clicking on the download button at the top right corner and then pressing the ‘export as .csv’ option.
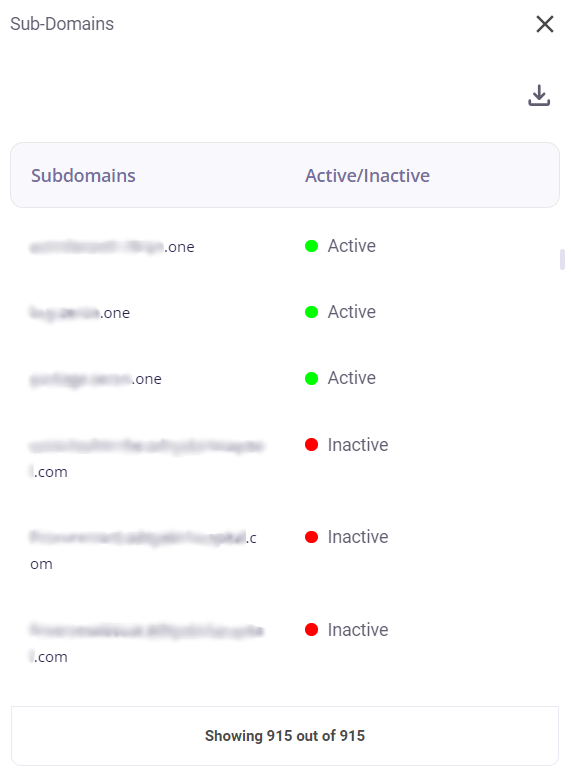
Sub-domains - This block displays the total number of all the sub-domains discovered so far. It also denotes the number of active subdomains and inactive subdomains based on the following colour code:
Green: Active
Red: Inactive

Clicking on this block provides the user with the list of the sub-domains and their operational status. This list of sub-domains can be downloaded as a .csv file by clicking on the download button at the top right corner and then pressing the ‘export as .csv’ option.
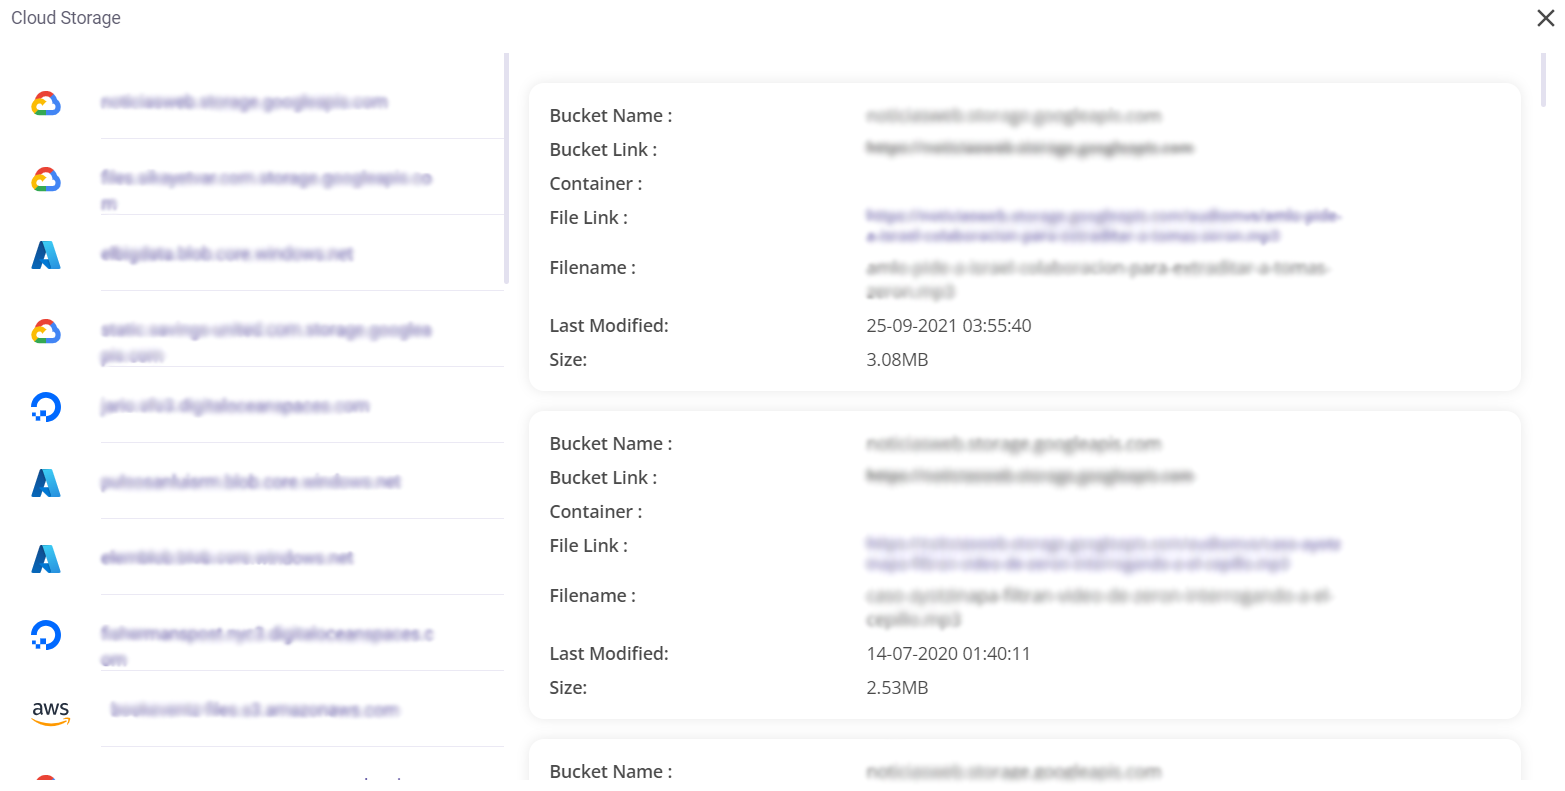
Cloud storage: This block displays the number of Cloud Buckets. Your organization's cloud buckets are investigated to acquire publicly available data in them. This data could consist of images, files, reports, etc. Ideally, its exposure should be avoided.

Clicking on this block provides the following insights about each cloud bucket:
- Bucket Name
- Link to the bucket
- Container (if found)
- File Name
- Link to the file
- Timestamp of last modification
- Size
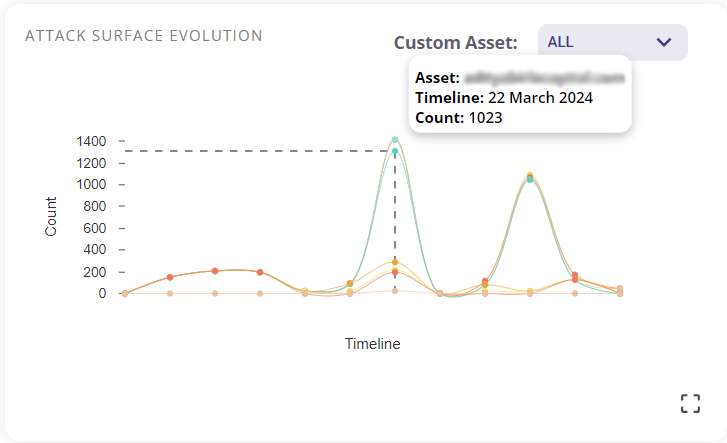
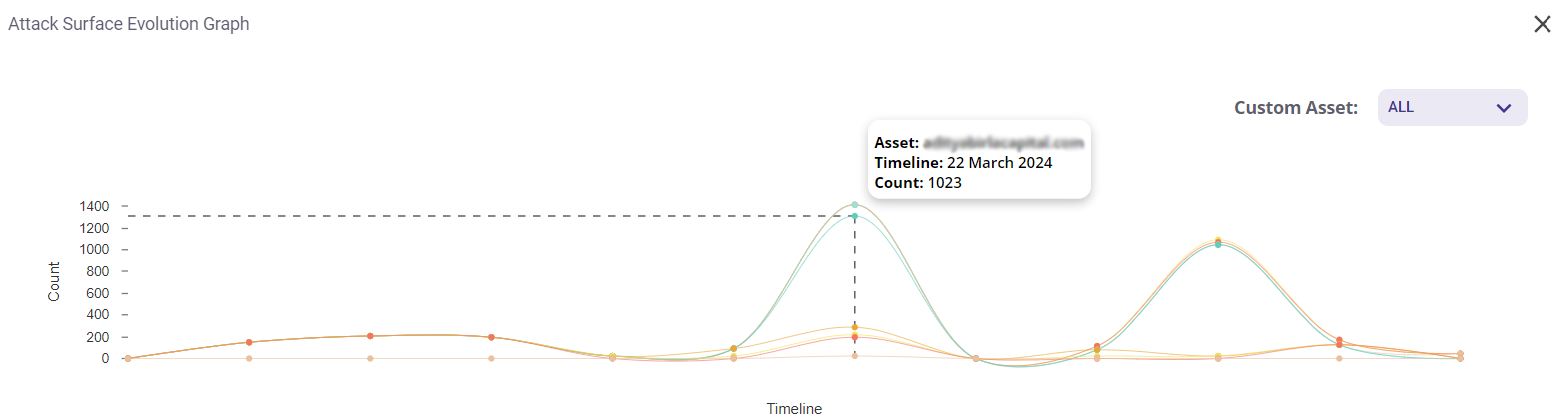
Attack Surface Evolution
This section provides a visual representation of asset evolution over time through a graph, enabling users to track changes in asset counts. Each asset is colour coded for enhancing readability and facilitating quick identification. Hovering over a particular asset’s line shows the asset name, time at that point in the graph and asset count at that time. This graph can be expanded by clicking on the full-screen icon present in the bottom right corner. The custom asset feature allows the user to select an asset of their choice and view its graph. To choose a particular asset, open on the drop-down menu and click on the desired asset name.
Domain Statistics
This block consists of a donut chart that shows the number of active/ inactive domains.
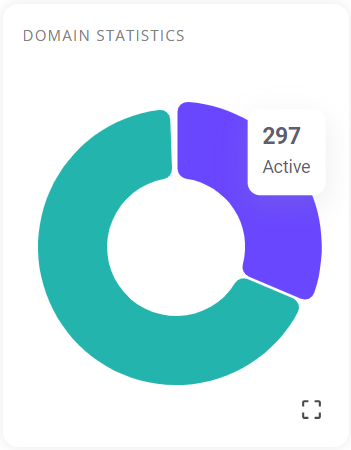
Clicking on the full screen icon on the bottom right corner produces a list of domain names. The user can choose to view a list of one of the following:
- active domains
- inactive domains
- Default login
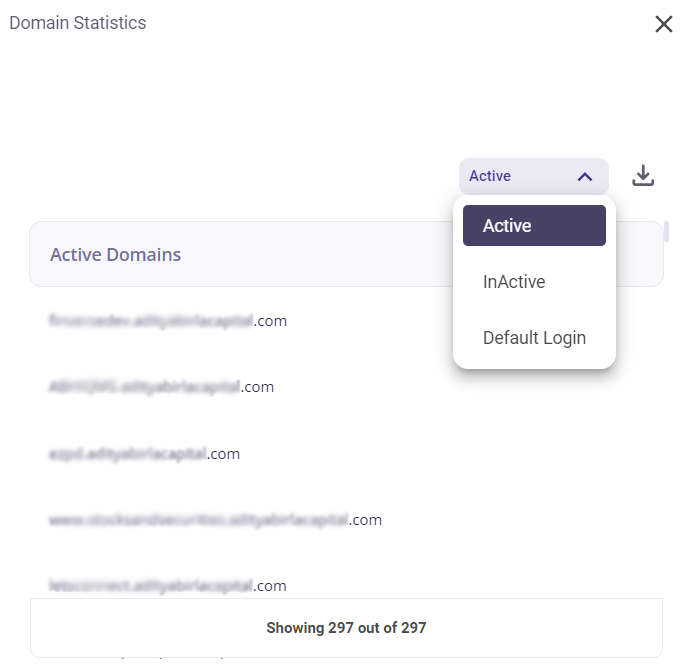
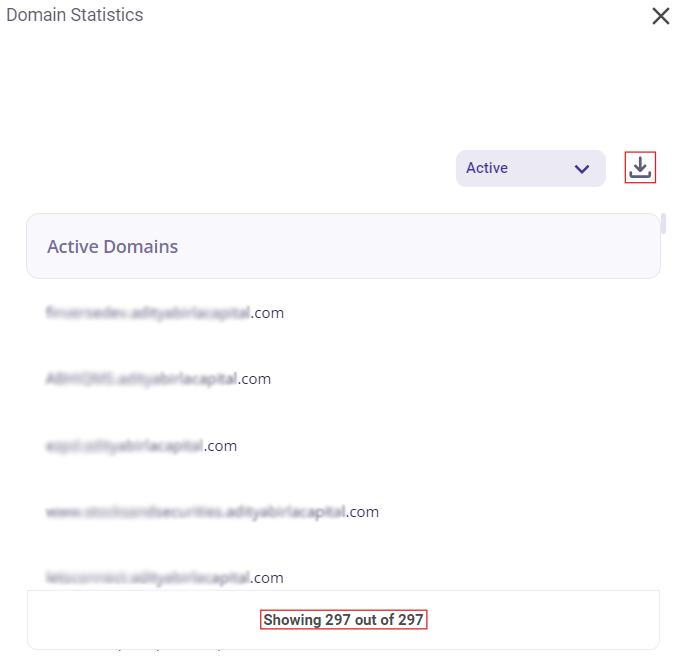
The total number of domains listed is provided at the bottom of the list. A .csv file of this list can be downloaded by clicking on the download icon in the top right corner.
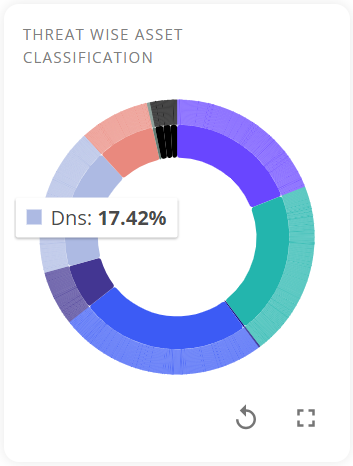
Threat wise asset classification
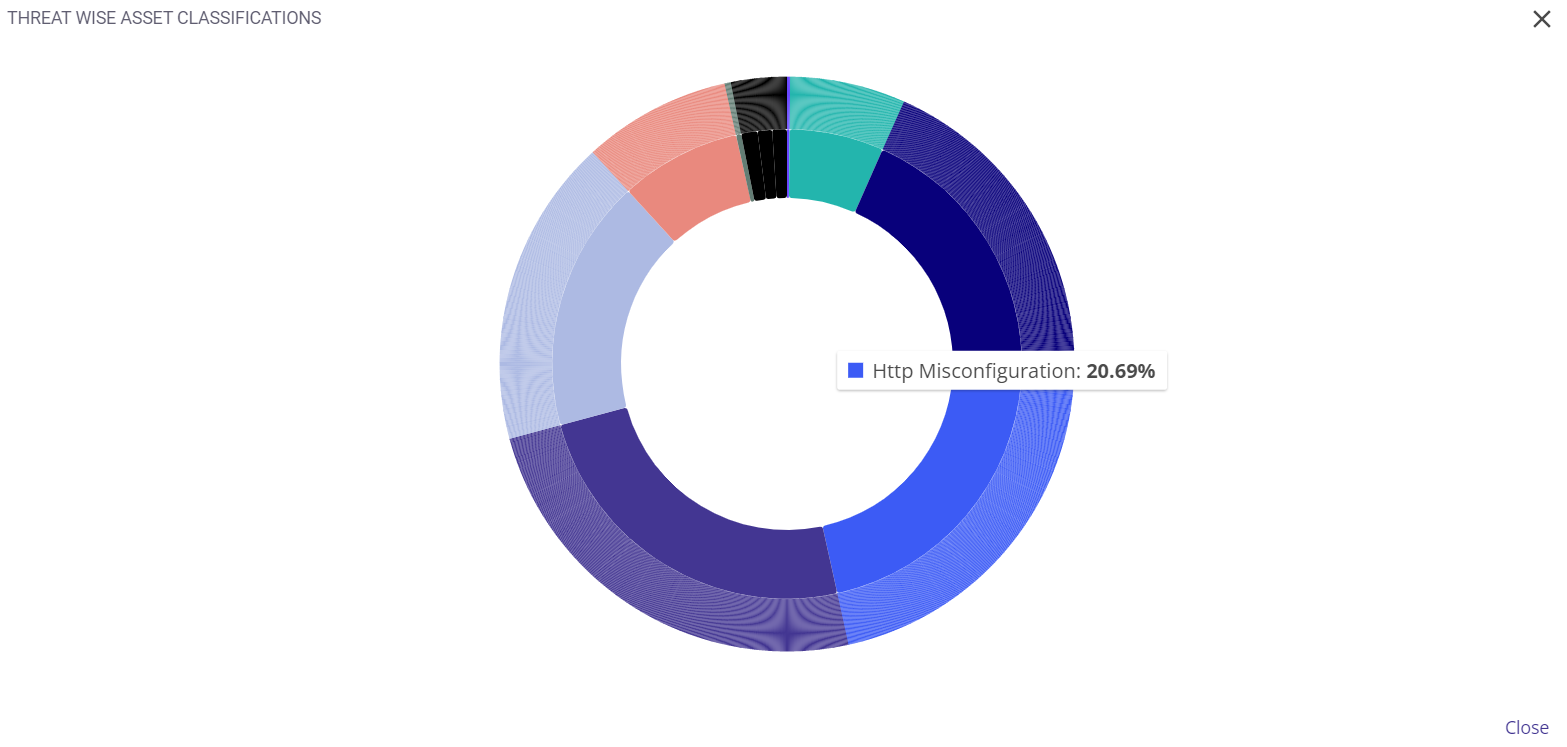
This block consists of a two-tiered donut chart. It displays a colour coded classification of assets that have been grouped according to the category of threat.
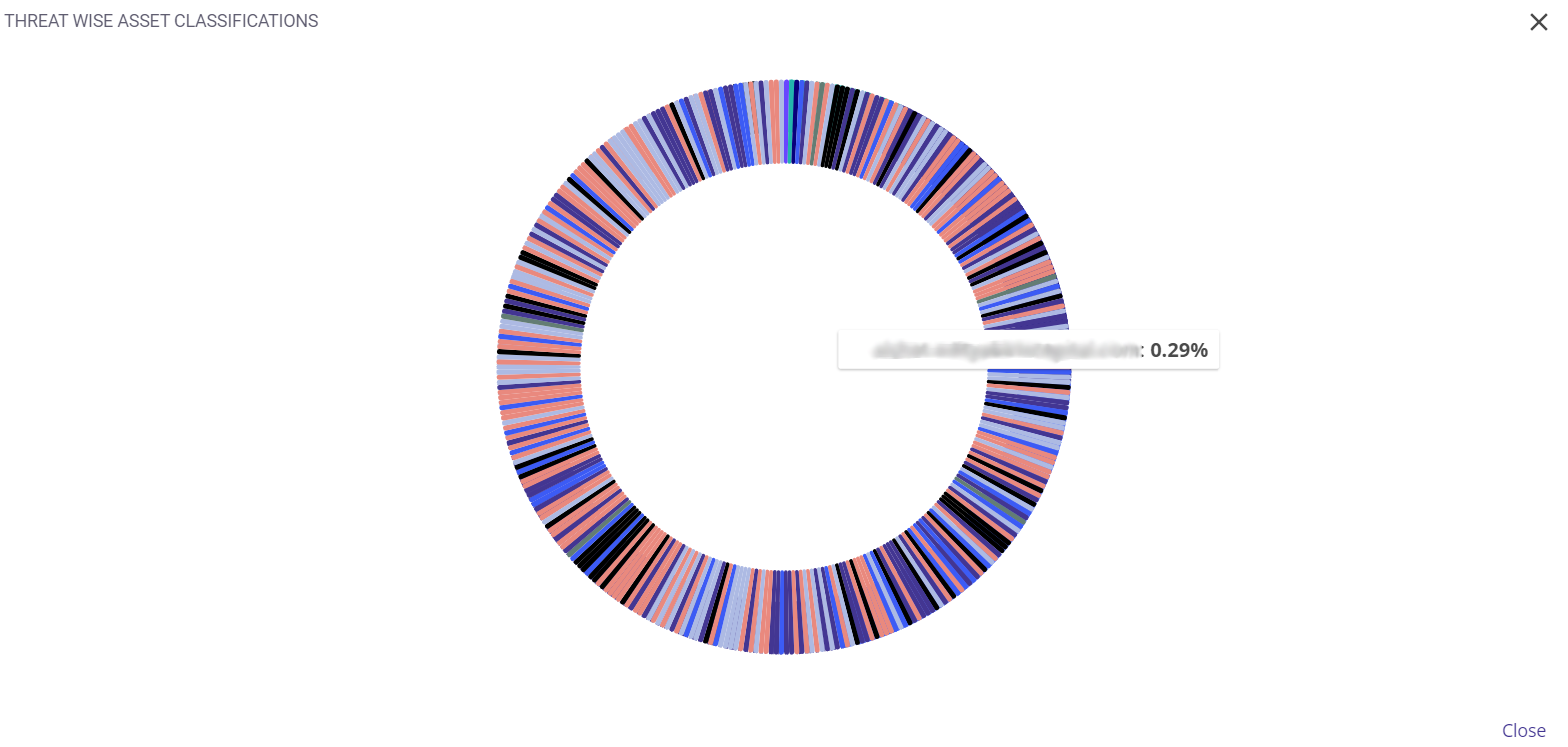
Tier 1: The outer tier in this chart consists of elements representing each asset. Hovering over an element in this tier displays the name of the asset.
Tier 2: The inner tier in this chart consists of elements representing the categories of threat. Hovering over an element in this tier displays the name of the threat.
Clicking on an attack category in Tier 2 causes the chart to remodel into another donut chart where each asset consisting of that attack category is displayed. Hovering over an element displays the name of that asset.
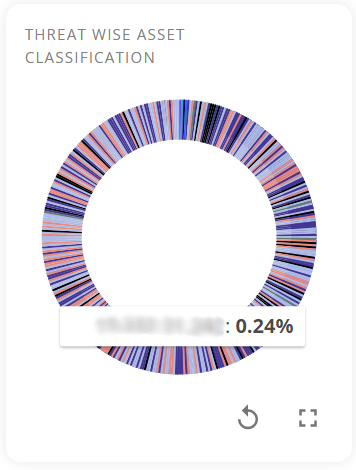
A larger view of the same can be viewed by clicking on the full screen icon on the bottom right of this block.
When an asset is clicked, multiple blocks for different threats it faces are displayed. The following details are shown about the threat in each block:
- Threat category
- Threat name
- Description
- Host
- Risk Probability
- Severity of the risk
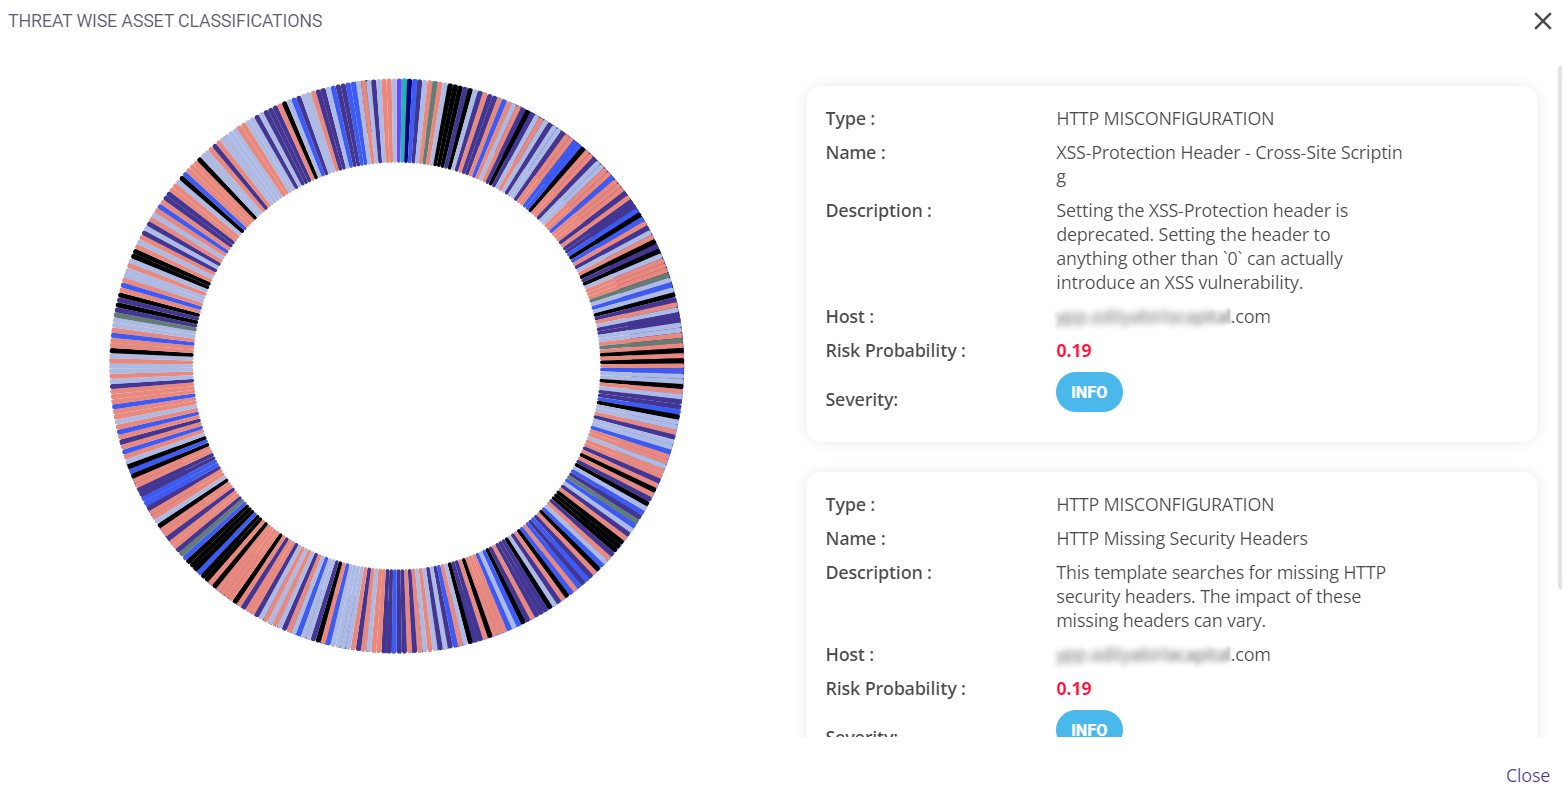
There are 5 levels of severity of risk:
- Info
- Low
- Medium
- High
- Critical
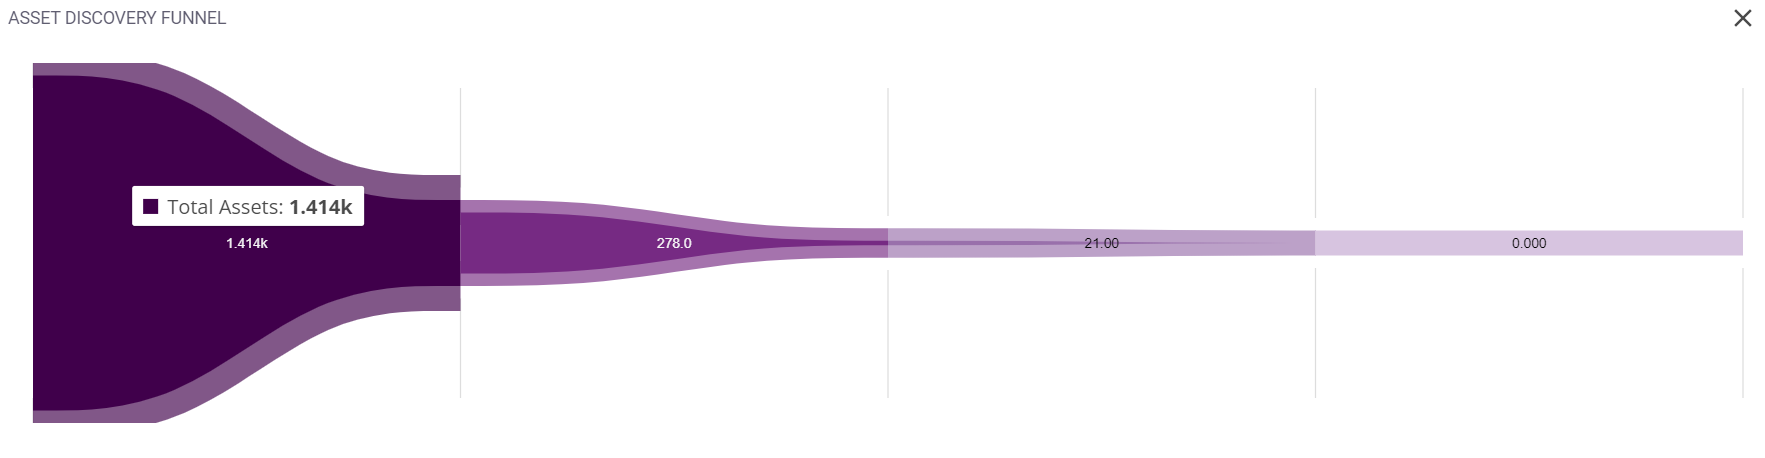
Asset discovery funnel
This section employs a funnel-like chart to illustrate the quantity of assets discovered during the scanning process. There are 4 subdivisions in the asset discovery funnel. They are as follows:
- First section: This section represents the total number of assets.
- Second section: this section represents the number of active subdomains.
- third section: This section represents the number of exposed login panels.
- Fourth section: This section represents the number of default login panels.