Risks
The risks faced by the organization are majorly categorized into two, based on the severity of the risk:
- Critical
- Medium.
Critical:
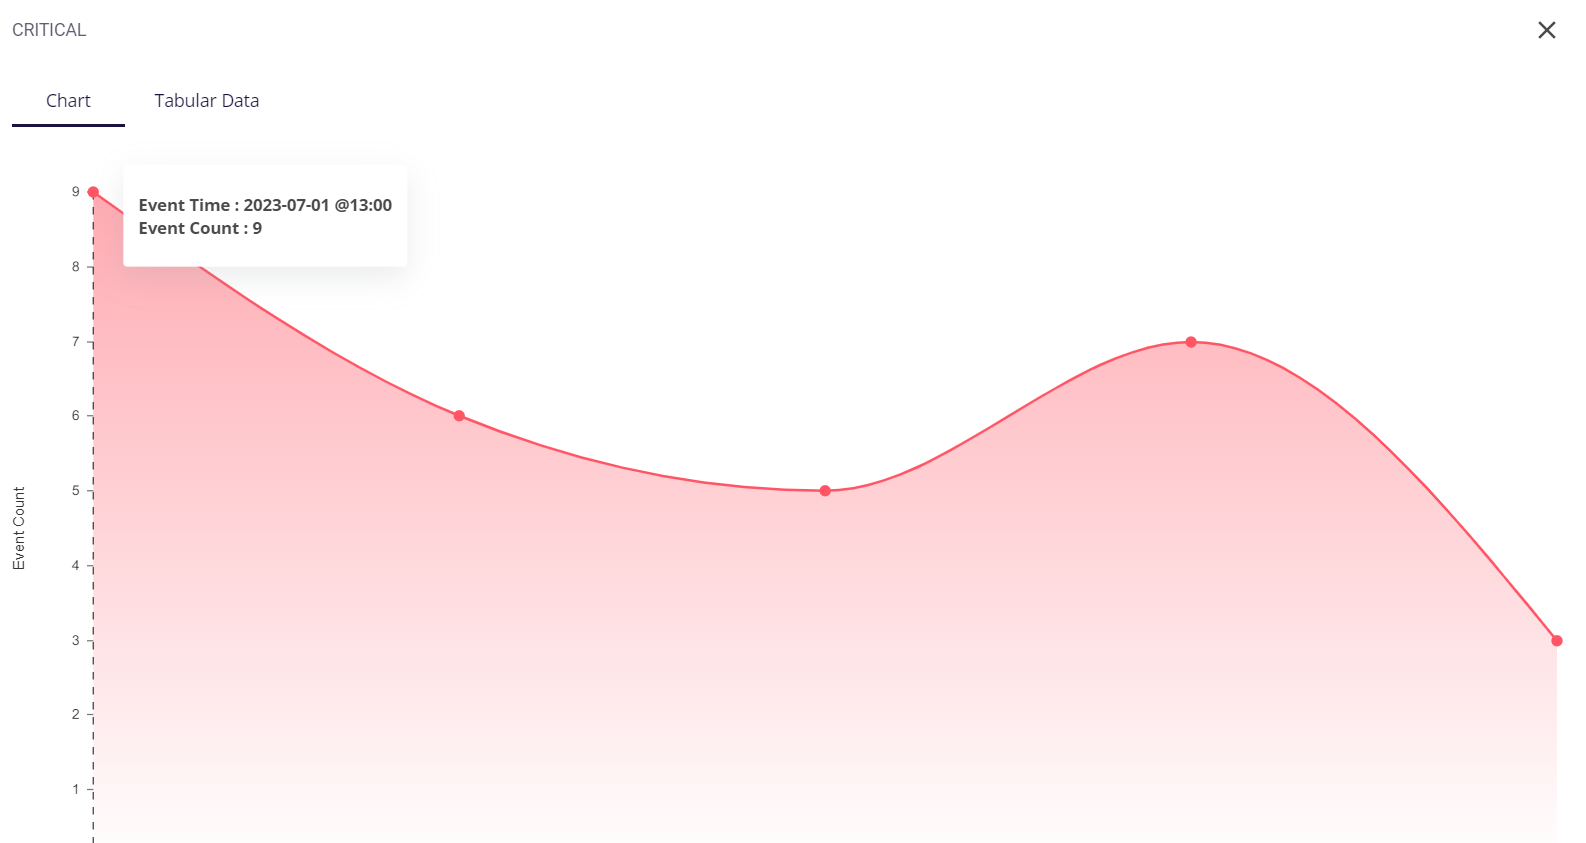
This section displays the number of critical events having a severity level in the range of 11-15. It also has a mini graph of all the events, which can be expanded by clicking on the full-screen icon present in the bottom right corner.

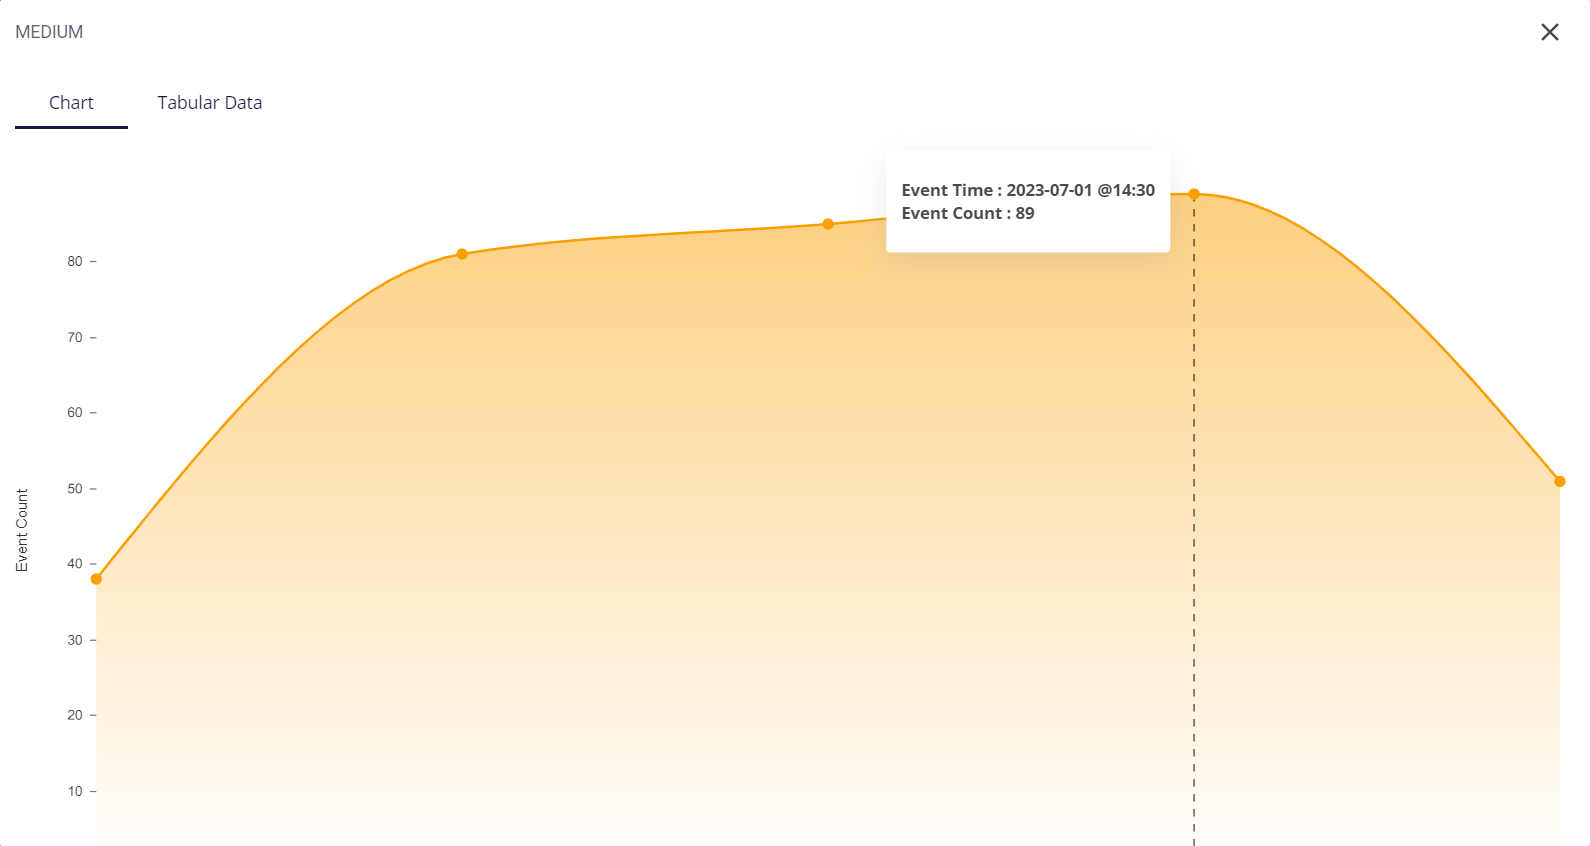
On expanding, the user can get a chart view and a tabular view. The chart view shows a graph that maps the event count at particular time intervals.
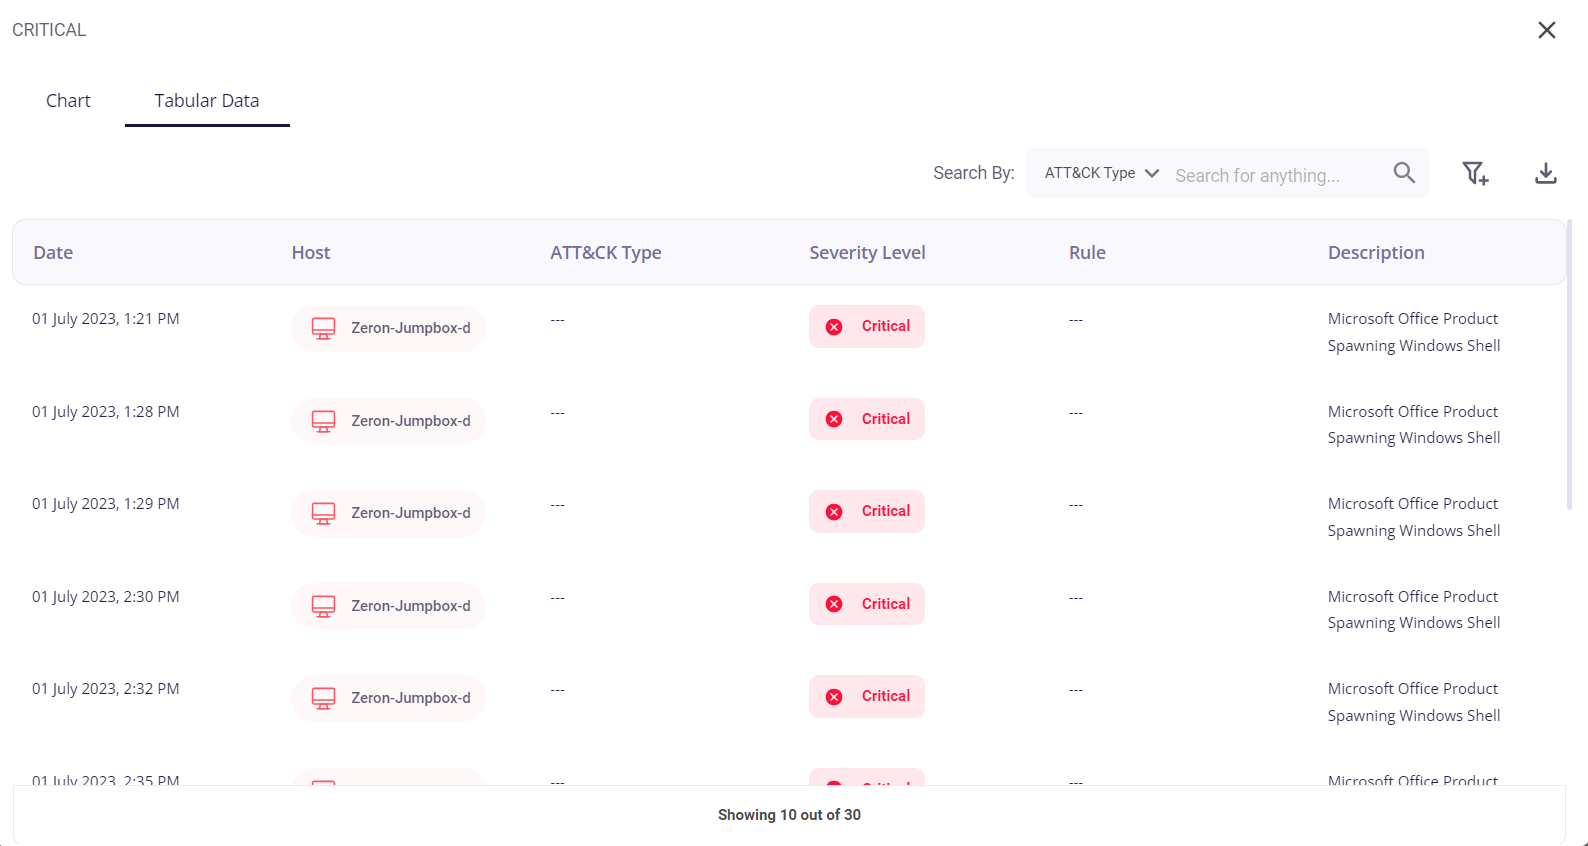
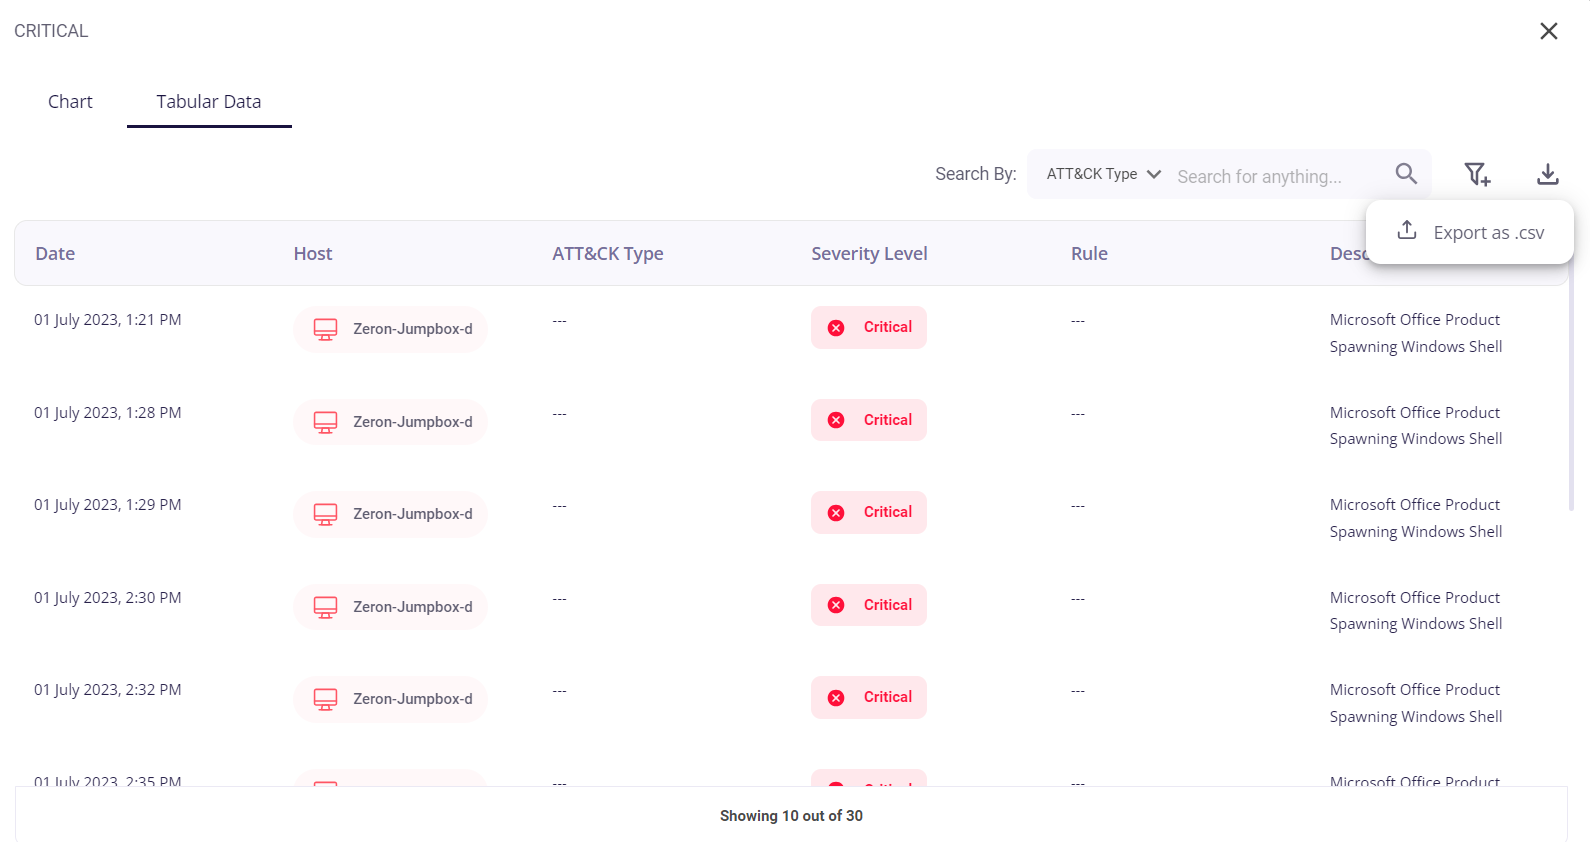
The tabular view contains the data which makes up the graph. This has a table containing five subsections for recording each event, namely: date, host, MITRE ATT&CK type, severity level, rule, and description. The total number of events recorded can be seen in the bottom center of the tabular data view.
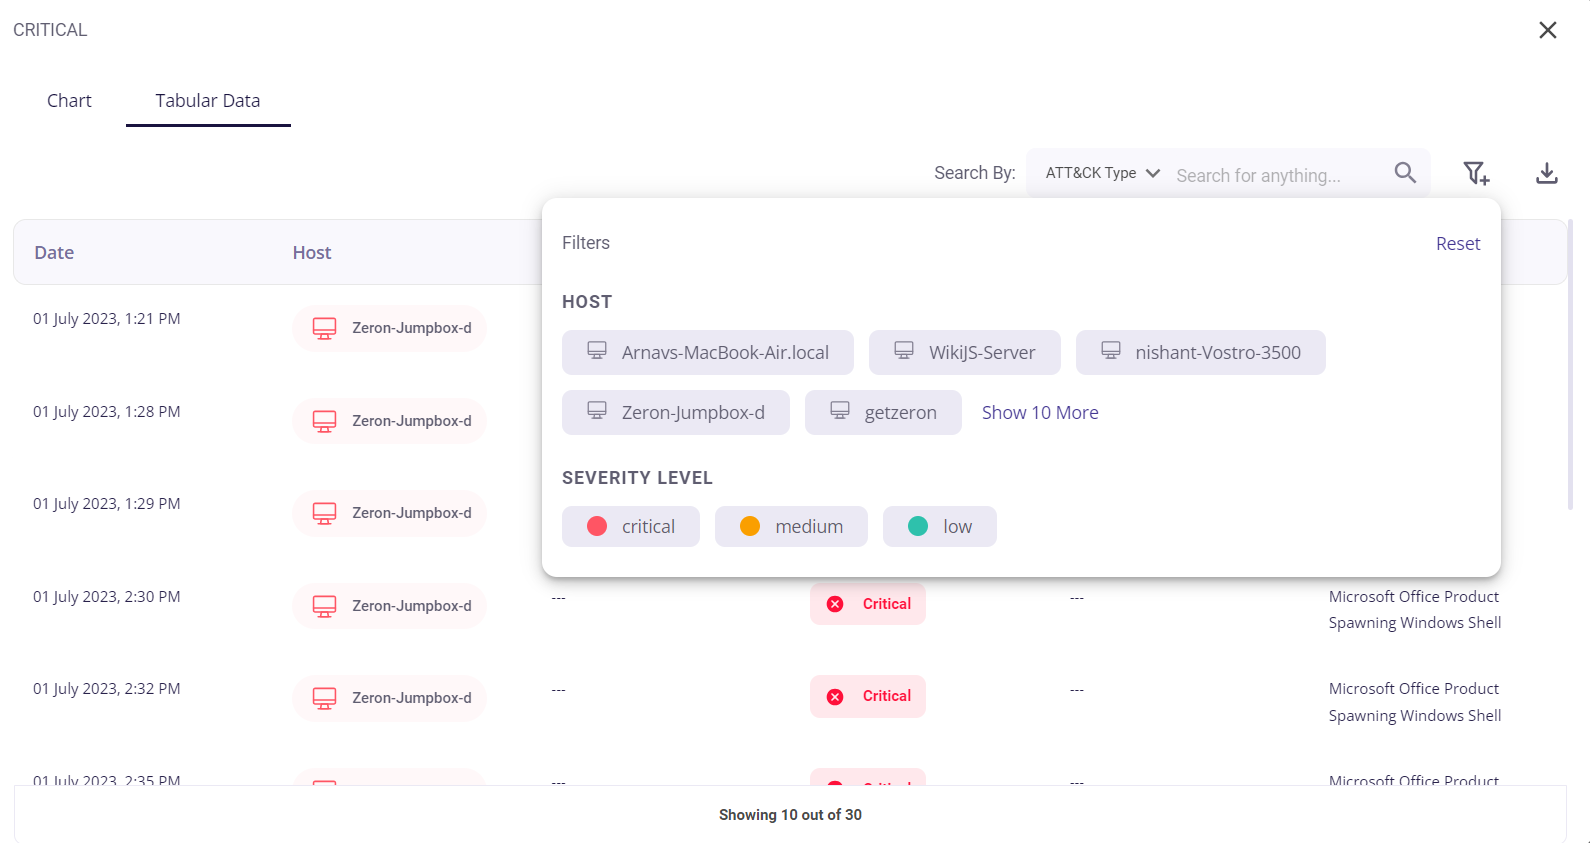
The user can search for a particular event or filter the events based on the host and severity level by clicking on the filter icon in the top right corner.
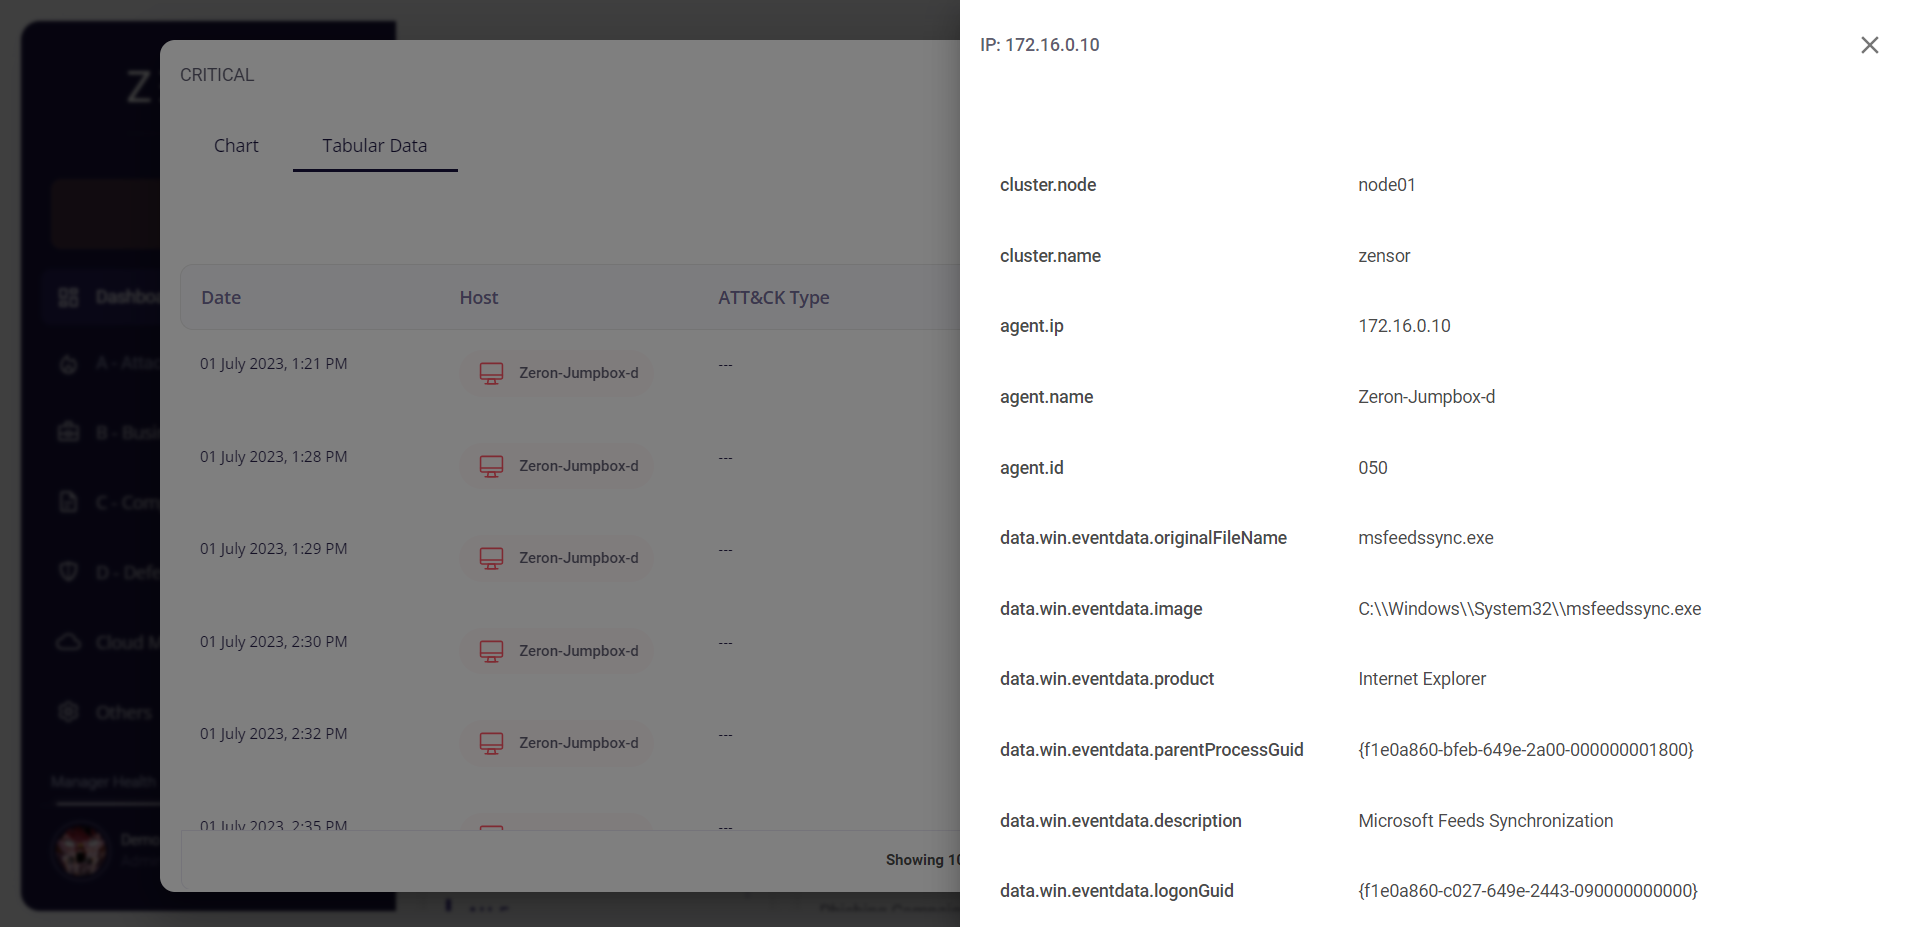
The user can also get more details about each event by clicking on it.
The tabular report can be downloaded as a .csv file by clicking on the download button and then pressing the ‘export as .csv’ option.
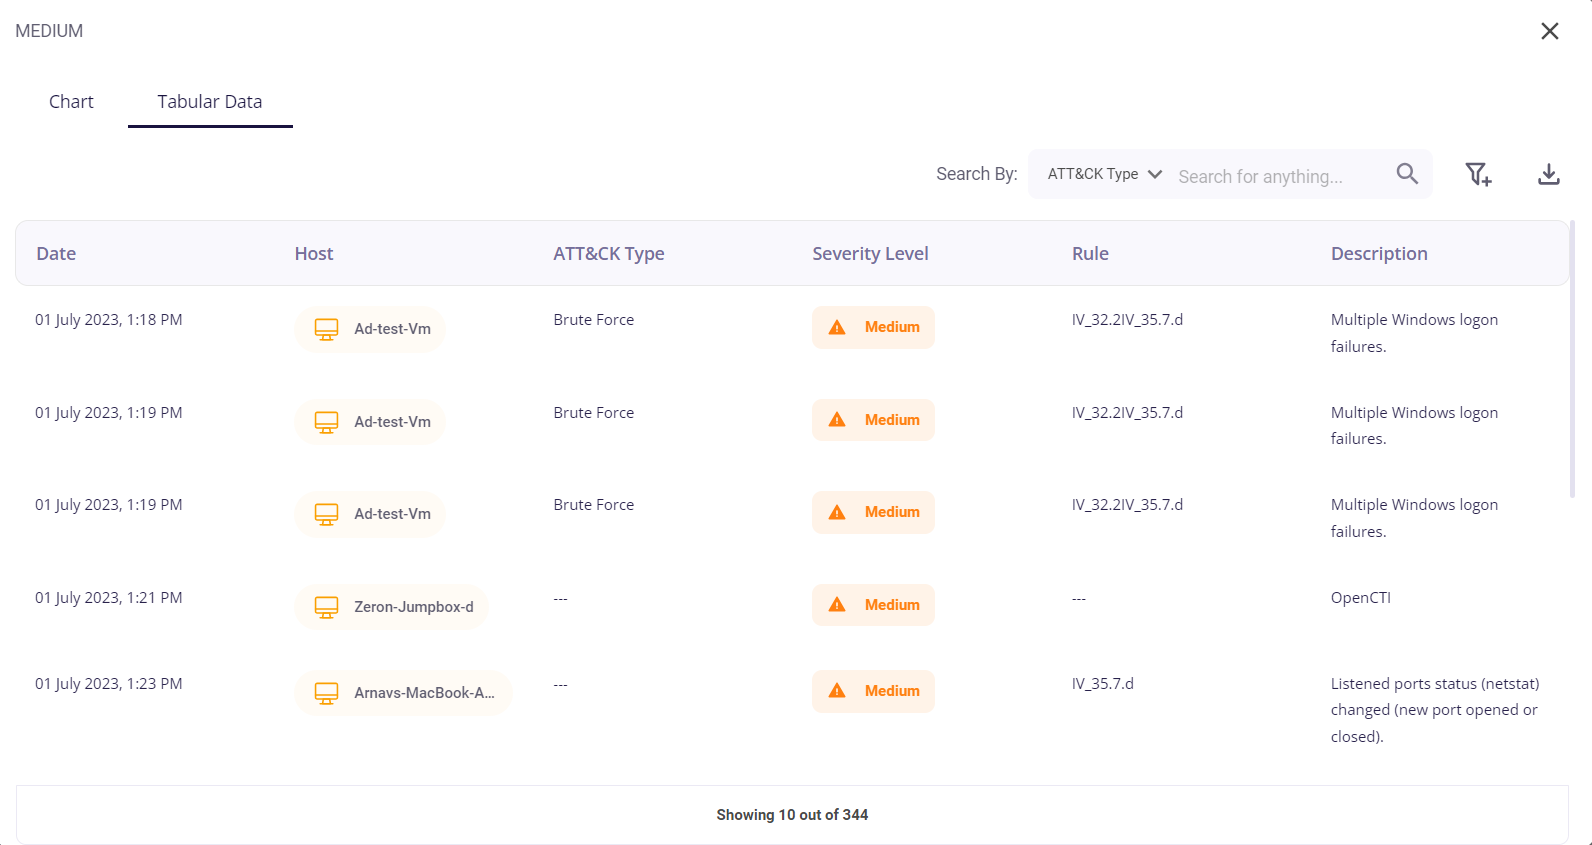
Medium:
This section displays the number of medium events having a severity level in the range of 6-10. Similar to the Critical Risks section, this too has a mini graph of all the events, which can be expanded by clicking on the full-screen icon present in the bottom right corner.

The Medium Risks section, when expanded, is similar to the Critical Risks section and has both chart and tabular viewing options.
Chart view:
Tabular view: